Customer Relationship Management
Customer relationship management is an important component of sales success. Visualizing sales data you may put some KPI related to customers relationship management to your Sales dashboard and track this important aspect in real time.Dashboard
ConceptDraw PRO extended with Sales Dashboard solution from the Marketing area of ConceptDraw Solution Park is a perfect software for creating the live dashboard for the business data and progress visualization.
 Logistic Dashboard
The powerful tools of Logistic Dashboard solution and specially developed live graphic objects of logistic icons, logistic navigation elements, logistic indicators, logistic charts and logistic maps effectively assist in designing Logistic dashboards, Logistic maps, Logistic charts, diagrams and infographics. The included set of prebuilt samples and quick-start templates, demonstrates the power of ConceptDraw PRO software in logistics management, its assisting abilities in development, realization and analyzing the logistic processes, as well as in perfection the methods of logistics management.
 ConceptDraw Dashboard for Facebook
ConceptDraw Dashboard for Facebook solution extends ConceptDraw PRO software with a dynamically updated visual dashboard, which shows lifetime total likes, daily friends of fans, and daily page views, information you can receive from Facebook Insights.
 PM Dashboards
This solution extends ConceptDraw PRO and ConceptDraw PROJECT software with the ability to clearly display the identified key performance indicators for any project.
 Sales Dashboard
Sales Dashboard solution extends ConceptDraw PRO software with templates, samples and library of vector stencils for drawing the visual dashboards of sale metrics and key performance indicators (KPI).
 Status Dashboard
Status dashboard solution extends ConceptDraw PRO software with templates, samples and vector stencils libraries with graphic indicators for drawing the visual dashboards showing status data.
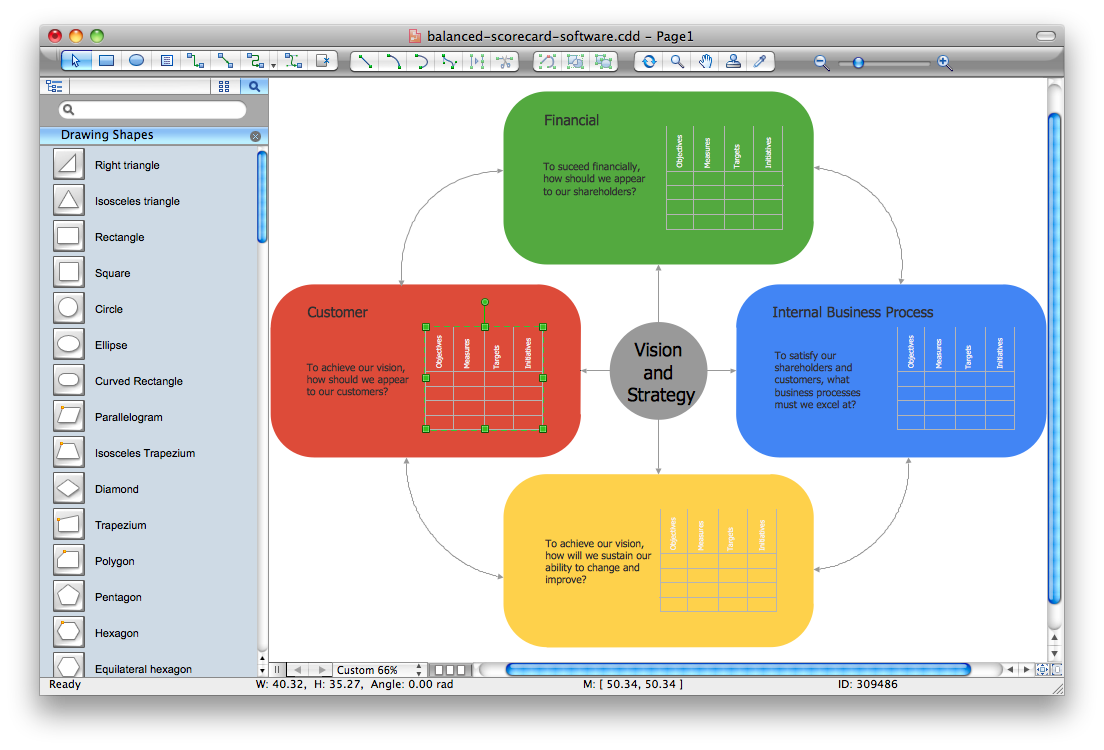
Balanced Scorecard Software
Balanced Scorecard Software provide incredible large variety of samples, templates and libraries of predesigned vector objects. Nothing could be easy that use the predesigned template and fill it, and simply drag the ready-to-use objects for designing your own balanced scorecard diagram.Export from ConceptDraw PRO Document to MS Visio® XML
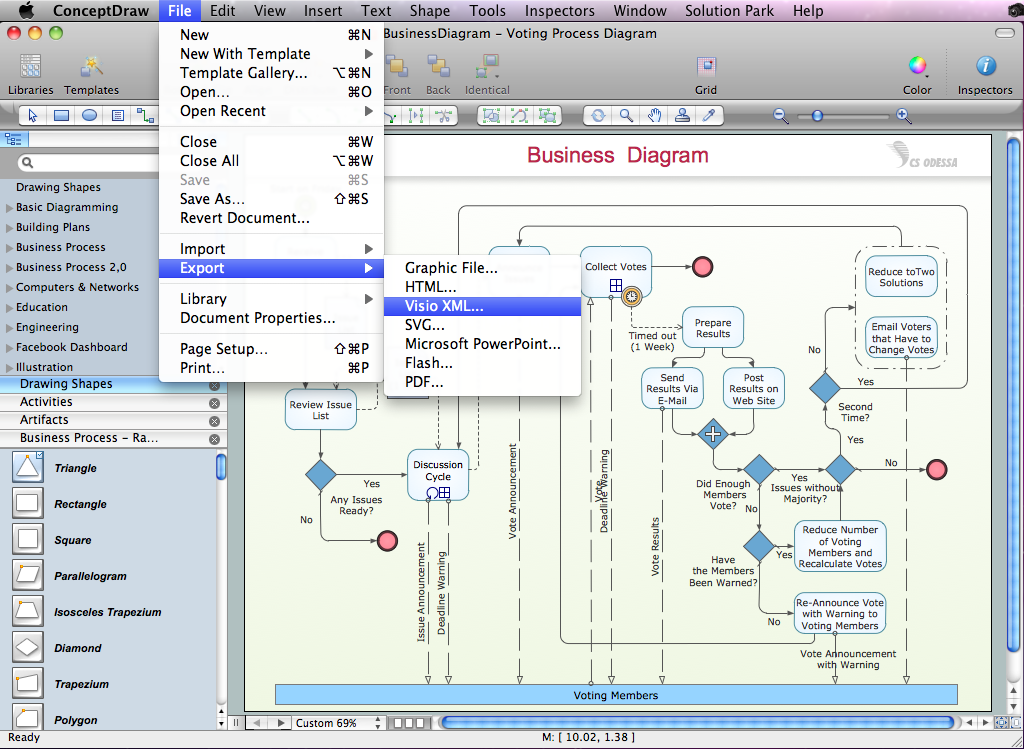
Once you have created your document in ConceptDraw PRO and you want to share it with your colleagues and friends, who uses MS Visio on their computers, you can easily export your document using ConceptDraw PRO export to Visio XML files (VDX) feature. Now you can share your ConceptDraw documents with MS Visio users.
 Meter Dashboard
Meter dashboard solution extends ConceptDraw PRO software with templates, samples and vector stencils library with meter indicators for drawing visual dashboards showing quantitative data.
Export from ConceptDraw PRO Document to a Graphic File
Now it’s easy to share your visual documents with other people in a form most convenient for them. ConceptDraw PRO can save your drawings and diagrams in a number of highly useful formats, including graphic files. You can save your drawing as a .PNG, .JPG, or other graphic format file.
 Seven Management and Planning Tools
Seven Management and Planning Tools solution extends ConceptDraw PRO and ConceptDraw MINDMAP with features, templates, samples and libraries of vector stencils for drawing management mind maps and diagrams.
Stakeholder Onion Diagrams
The Stakeholder Onion Diagram is a popular and widely used way to view the relationships of stakeholders to a project goal. The Onion Diagram focuses on the project goal, most of other diagram styles focus on the project, stakeholders, and timeline. This difference favorably distinguishes and separates the Onion Diagram from other types of diagrams. Design fast and easy Stakeholder Onion Diagrams of any complexity in ConceptDraw PRO diagramming and vector drawing software using the powerful tools of Stakeholder Onion Diagrams Solution from the Management Area of ConceptDraw Solution Park.
 Stakeholder Onion Diagrams
The Stakeholder Onion Diagram is often used as a way to view the relationships of stakeholders to a project goal. A basic Onion Diagram contains a rich information. It shows significance of stakeholders that will have has influence to the success achieve
HelpDesk
How to Connect Text Data to a Time Series Chart on Your Live Dashboard
Time Series Dashboard means an integration of some type of diagrams: Line Charts, Bar Charts, Column Charts, and Dot Plots on a single space. The ConceptDraw Time Series Dashboard solution can be used to create the interactive Time Series dashboard. The libraries of Time Series Charts solution contain the Live Objects, that can change their appearance depending on the external data. Each chart from the Time Series dashboard displays particular source data. You can include Time Series Charts in your business or technical dashboards to show and compare the items changing over time.
- Productivity Metrics Template
- KPIs and Metrics | Business Intelligence Dashboard | Competitor ...
- Correlation Dashboard | Correlation dashboard - Template | Design ...
- KPI Dashboard | Sales Dashboard Template | Data Visualization ...
- Safety Kpi Metrics
- Software Kpi Sample Template
- Kpi Template
- Excel Safety Scorecard Template
- Scatter Diagrams | Correlation Dashboard | Process Flowchart ...
- Hr Metrics Dashboard Template
- Key Performance Indicator Excel Template
- Correlation Dashboard | Website traffic dashboard | Business ...
- Kpi For Drawings Designer
- Performance Metrics Template
- Gauge Excel Template
- Performance Indicators | What is a KPI ? | KPI Dashboard | Sales ...
- Business Intelligence Dashboard | Correlation Dashboard | Sales ...
- Sales KPI Dashboards
- Export from ConceptDraw PRO Document to a Graphic File | KPI ...


