How to Draw a Line Graph
In your work activity you need regularly draw the line graphs? And each time you ask yourself a question "How to Draw a Line Graph easier and faster?". The desire to automate the line graphs drawing process led to the creation of Line Graphs solution from Graphs and Charts area of ConceptDraw Solution Park.Line Graph
ConceptDraw PRO extended with Line Graphs solution from Graphs and Charts area of ConceptDraw Solution Park is ideal software for quick and simple drawing professional looking line graph.Picture Graph
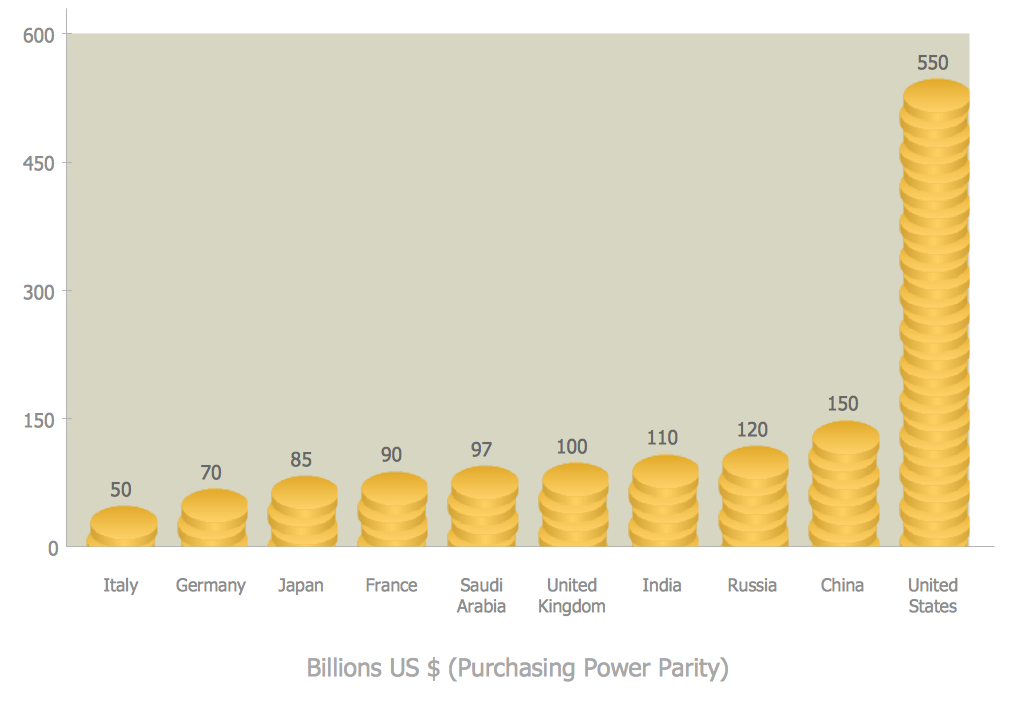
A Picture Graph is a popular and widely used type of a bar graph, which represents data in various categories using the pictures. ConceptDraw PRO extended with Picture Graphs solution from the Graphs and Charts area of ConceptDraw Solution Park is the best software for fast and simple drawing professional looking Picture Graphs.Line Chart Template for Word
This sample was created in ConceptDraw PRO diagramming and vector drawing software using the Line Graphs Solution from Graphs and Charts area of ConceptDraw Solution Park.This sample shows the Line Chart of annual percentage change. The Line Chart allows you to clearly see the changes of data over the time.
Bar Graph
You need to draw the Bar Graph? The automated tool can be useful for you. ConceptDraw PRO diagramming and vector drawing software extended with Bar Graphs solution from Graphs and Charts area of ConceptDraw Solution Park will help you create any Bar Graph.Chart Maker for Presentations
Easy charting software comes with beautiful chart templates and examples. This makes it easy to create professional charts without prior experience.
 Picture Graphs
Typically, a Picture Graph has very broad usage. They many times used successfully in marketing, management, and manufacturing. The Picture Graphs Solution extends the capabilities of ConceptDraw PRO v10 with templates, samples, and a library of professionally developed vector stencils for designing Picture Graphs.
Polar Graph
This sample shows the Polar Graph. The Polar Graph is a graph in the polar coordinate system in which the each point on the plane is defined by two values - the polar angle and the polar radius. The certain equations have very complex graphs in the Cartesian coordinates, but the application of the polar coordinate system allows usually produce the simple Polar Graphs for these equations.Bar Chart
ConceptDraw PRO extended with Bar Graphs solution from Graphs and Charts area of ConceptDraw Solution Park is ideal software for quick and simple drawing bar chart of any complexity graph.Step Area Graph
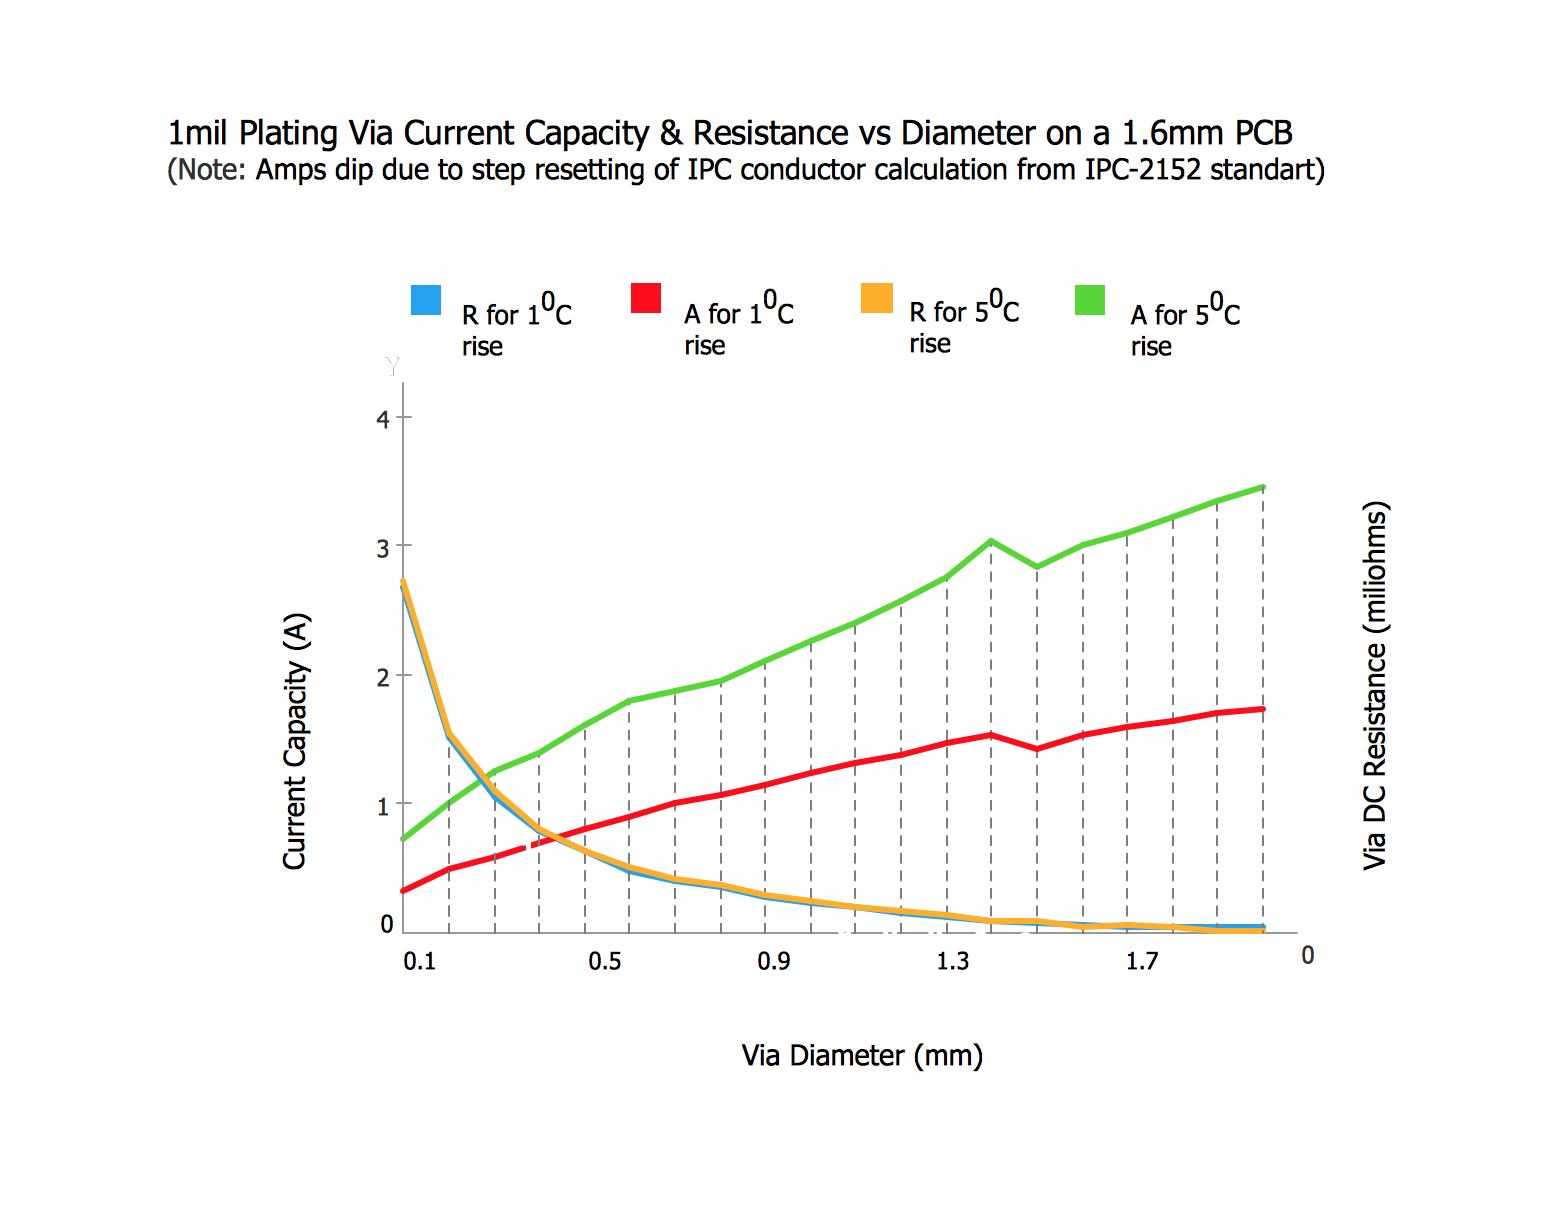
This sample shows the Step Area Graph of the PCB (Printed circuit board) Via current capacity and can be useful in electronics. It is displayed 1 mil plating Via current capacity and the resistance vs diameter on a 1.6 mm PCB. A via is an electrical connection between the layers in the electronical circuit that in PCB consists of two pads on the different electrically connected layers of the board.Chart Software for Better Presentations
Easy charting software comes with beautiful chart templates and examples. This makes it easy to create professional charts without prior experience.Graphs and Charts Area provide a wide collection of professional looking predesigned templates, samples and ready-to-use vector stencils that will help you to draw the charts and diagrams of various types: Pie Charts, Donut Charts, Line Charts, Column Charts, Bar Charts, Pyramids, Scatter Charts, Venn Diagrams, Spider Charts, Area Charts, Divided Bar Graphs.
 Line Graphs
How to draw a Line Graph with ease? The Line Graphs solution extends the capabilities of ConceptDraw PRO v10 with professionally designed templates, samples, and a library of vector stencils for drawing perfect Line Graphs.
HelpDesk
How to Create a Picture Graph in ConceptDraw PRO
Picture Graphs are used commonly to represent non-complex data to a large audience. A Picture Graph is simple kind of marketing diagram used to show the relationship among various quantities. It include pictures or symbols to represent information visually. There are many cases when you have just some numbers to show and compare. This is not a reason to not use visual tools. You can produce a simple picture graph using memorable symbols to get the best visual presentation. Using specific symbols instead of regular colored bars makes picture graphs a much more descriptive tool. You can use tools from an existing library or find appropriate clipart in ConceptDraw’s collection. ConceptDraw PRO allows you to draw a simple and easy to understand Graph Charts using the special library.Rainfall Bar Chart
This sample shows the Horizontal Bar Chart of the average monthly rainfalls.This sample was created in ConceptDraw PRO diagramming and vector drawing software using the Bar Graphs Solution from the Graphs and Charts area of ConceptDraw Solution Park.
Business Report Pie. Pie Chart Examples
This sample shows the Business Report Pie Chart. The Pie Chart visualizes the data as the proportional parts of a whole, illustrates the numerical proportion. Pie Charts are very useful in the business, statistics, analytics, mass media.- Bar Graphs | Picture Graphs | Line Graphs | Graphs
- Line Chart | Line Graph | Chart Software for Better Presentations ...
- How to Draw a Line Graph | Line Graph | Picture Graphs | Images Of ...
- Picture Of Line Graph And Bar Graph
- How to Draw a Line Graph | Line Graph | Picture Graph | Simple ...
- Picture Graphs | How to Create a Picture Graph in ConceptDraw ...
- Picture Graphs | Picture Graph | How to Create a Picture Graph in ...
- Image Of Bar Graph Pie Chart And Linear Graph
- Line Graphs Image
- Picture Graph | Pictures of Graphs | Line Graph | Images Of Pie ...
- Line Graph | How to Draw a Line Graph | Line Chart Template for ...
- Bar Graphs | Line Graphs | Picture Graphs | Graph
- Line Graph Images
- Process Flowchart | Line Graph | Scientific Symbols Chart | Image ...
- Line Graphs | Picture Graphs | People | Images Graphs On Growth ...
- Picture Graphs | Line Graphs | Matrices | Images Of Graphs For The ...
- Line Graph | Line Chart Examples | Pictures of Graphs | Line Graph ...
- Picture Graphs | Pictures of Graphs | Area Charts | Population ...
- Picture Graphs | Matrices | Line Graphs | Growth And Maintenance ...
- Picture Graph | Infographic Maker | Line Graph | Image Draw ...
- ERD | Entity Relationship Diagrams, ERD Software for Mac and Win
- Flowchart | Basic Flowchart Symbols and Meaning
- Flowchart | Flowchart Design - Symbols, Shapes, Stencils and Icons
- Flowchart | Flow Chart Symbols
- Electrical | Electrical Drawing - Wiring and Circuits Schematics
- Flowchart | Common Flowchart Symbols
- Flowchart | Common Flowchart Symbols


