The PERT chart shows the logical connections and consequence of a set of tasks. PERT charts the time period for problem solving and the implementation plan for all activities along the critical path. The PERT chart is also known as a precedence diagram or project network diagram.
"The Program (or Project) Evaluation and Review Technique, commonly abbreviated PERT, is a statistical tool, used in project management, that is designed to analyze and represent the tasks involved in completing a given project. ...
PERT is a method to analyze the involved tasks in completing a given project, especially the time needed to complete each task, and to identify the minimum time needed to complete the total project.
PERT was developed primarily to simplify the planning and scheduling of large and complex projects. ...
A network diagram can be created by hand or by using diagram software. There are two types of network diagrams, activity on arrow (AOA) and activity on node (AON). Activity on node diagrams are generally easier to create and interpret." [Program Evaluation and Review Technique. Wikipedia]
The PERT chart is one of the Seven Management and Planning Tools (7 MP tools, Seven New Quality Tools).
The PERT chart template for the ConceptDraw PRO diagramming and vector drawing software is included in the solution "Seven Management and Planning Tools" from the Management area of ConceptDraw Solution Park.
PERT chart template

Legend

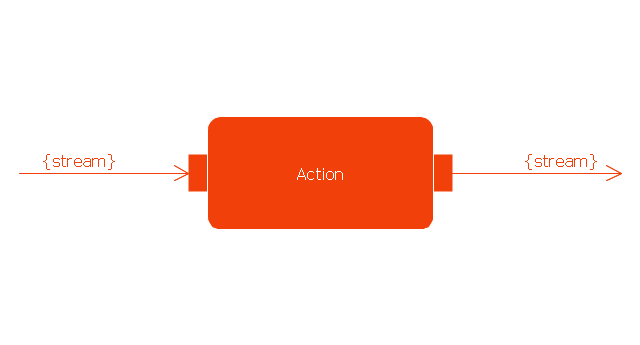
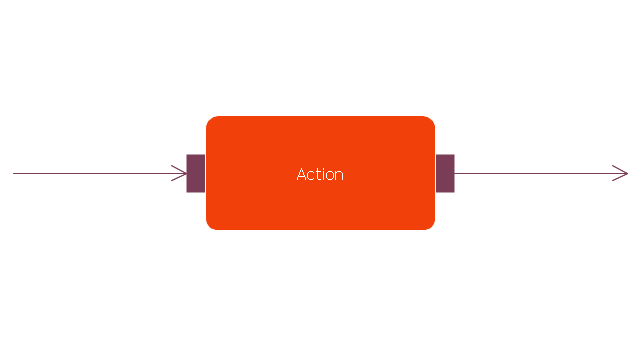
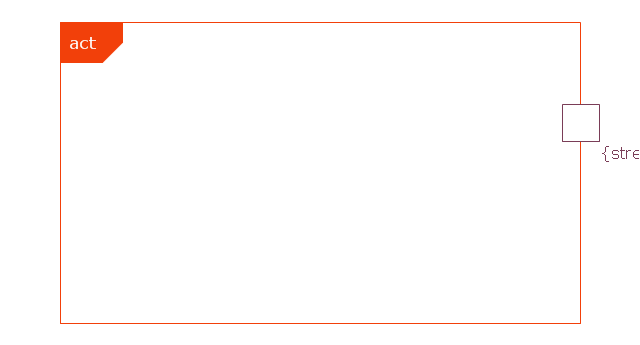
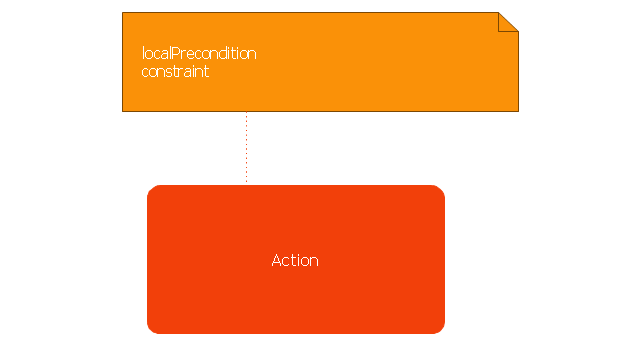
This vector stencils library contains 47 SysML activity diagram symbols.
Use it to design your SysML activity diagrams using ConceptDraw PRO diagramming and vector drawing software.
"Activity diagrams are constructed from a limited number of shapes, connected with arrows. The most important shape types:
- rounded rectangles represent actions;
- diamonds represent decisions;
- bars represent the start (split) or end (join) of concurrent activities;
- a black circle represents the start (initial state) of the workflow;
- an encircled black circle represents the end (final state).
Arrows run from the start towards the end and represent the order in which activities happen." [Activity diagram. Wikipedia]
The vector stencils library "Activity diagram" is included in the SysML solution from the Software Development area of ConceptDraw Solution Park.
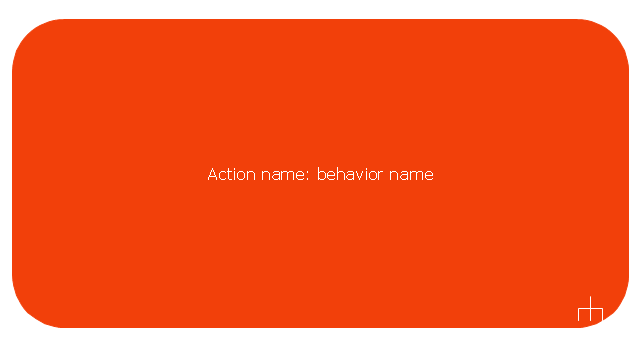
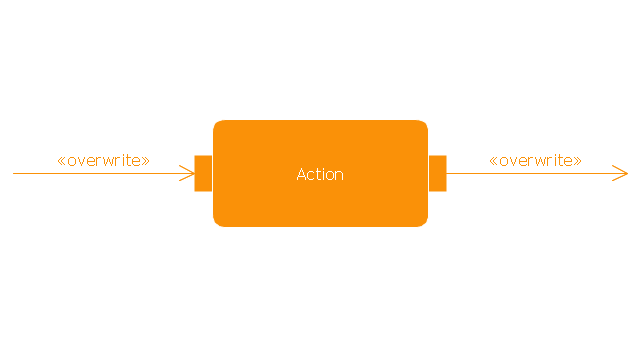
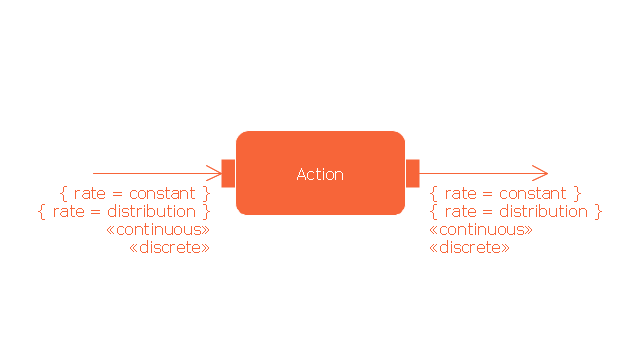
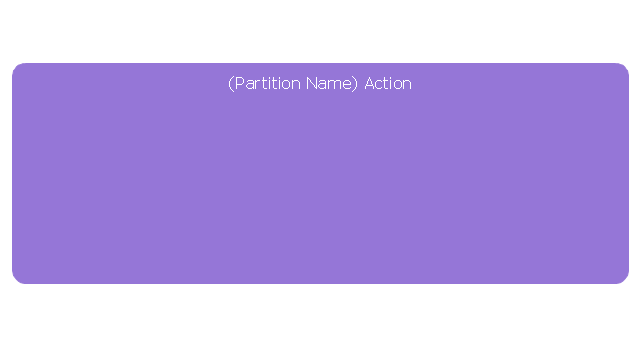
Action

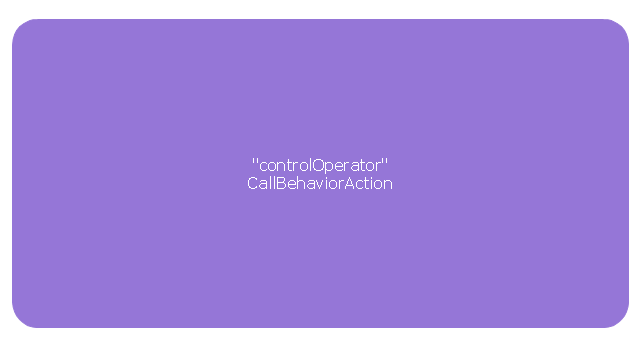
Call behavior action
Accept event action

Accept time event action

Send signal action

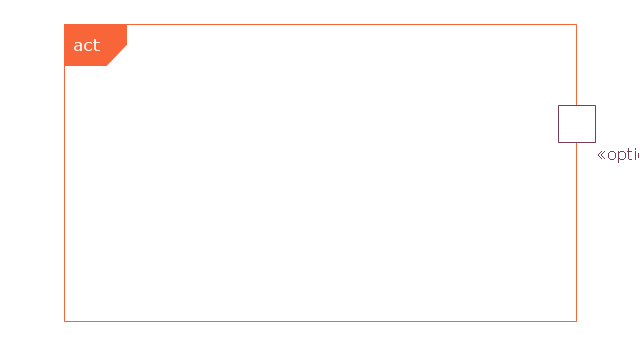
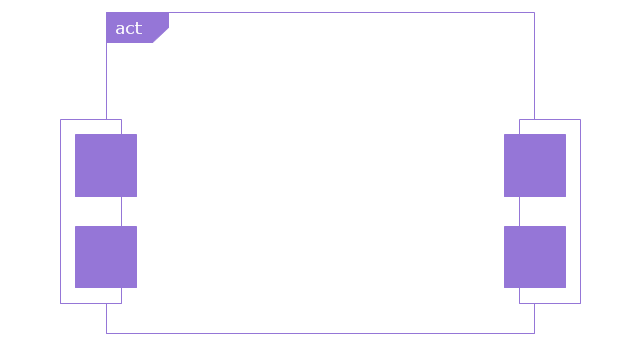
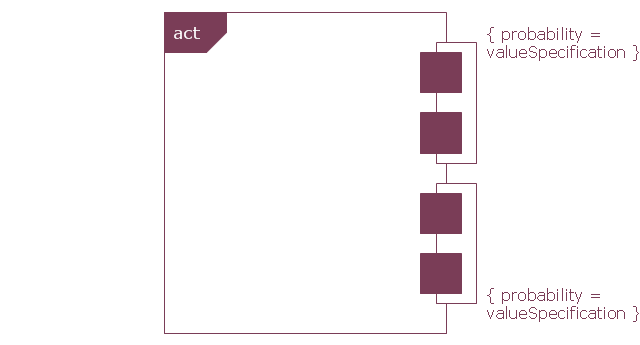
Activity

Activity final node

Flow final node

Activity parameter node

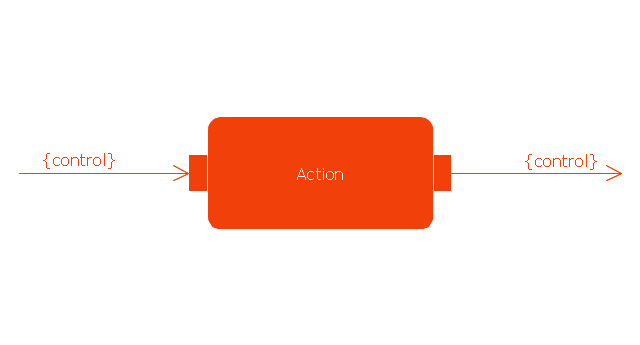
Control operator node
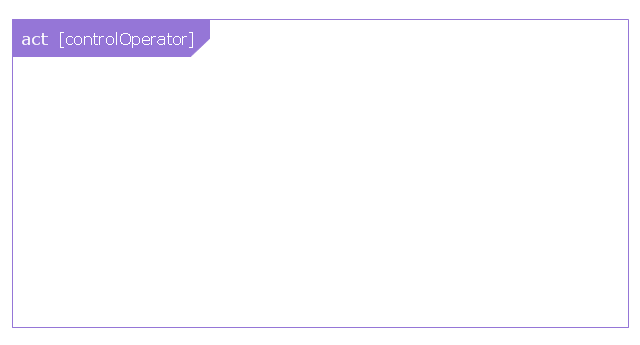
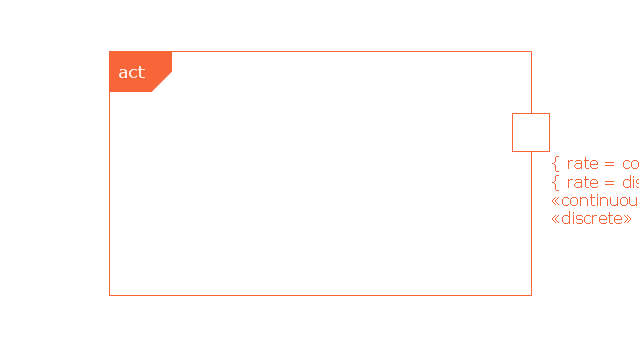
Control operator - frame
Decision/Merge node

Fork/Join node

Initial node

isControl
isStream
isStream 2
isStream 3
Local precondition
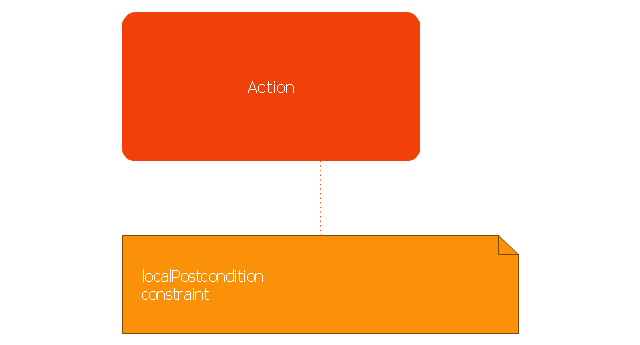
Local postcondition
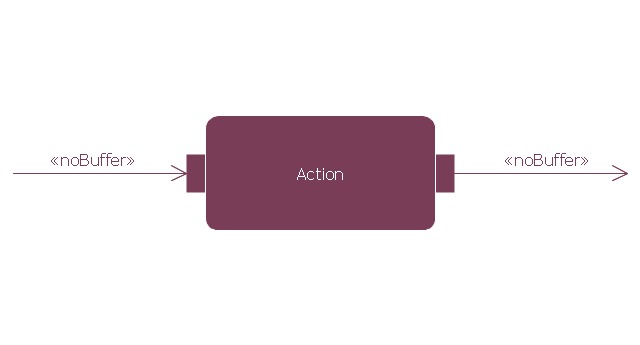
NoBuffer
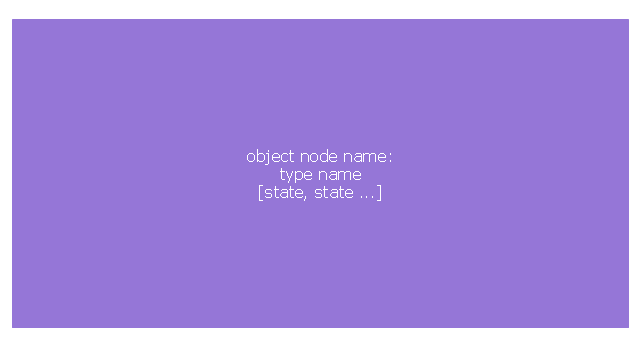
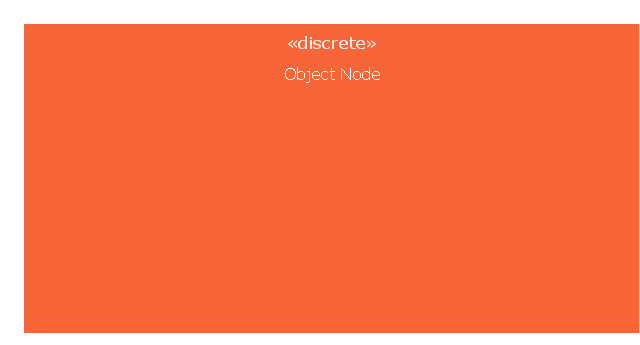
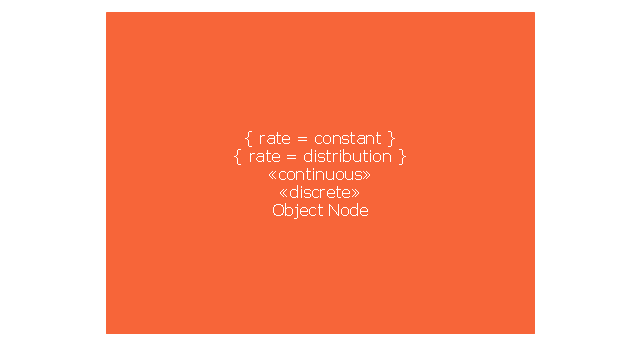
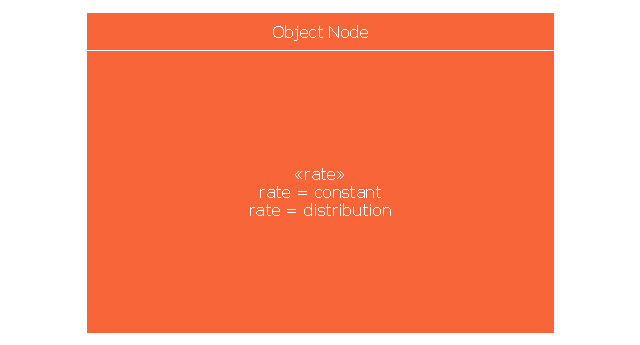
Object node
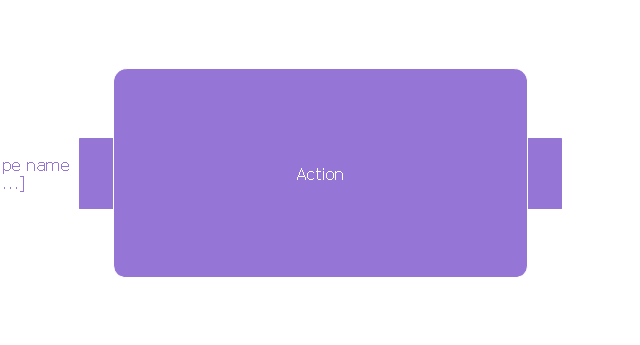
Object node 2
Optional
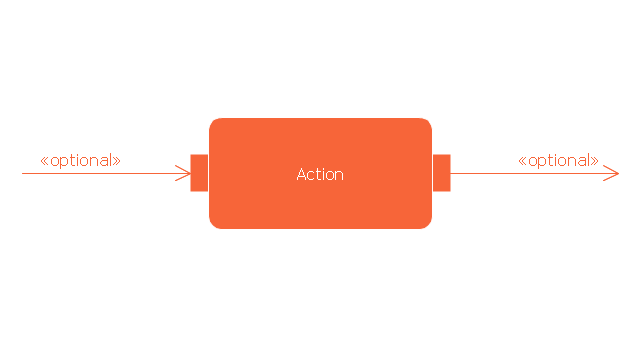
Optional 2
OverWrite
Parameter set
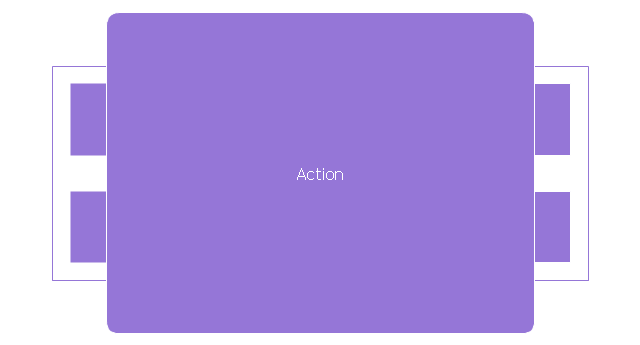
Parameter set 2
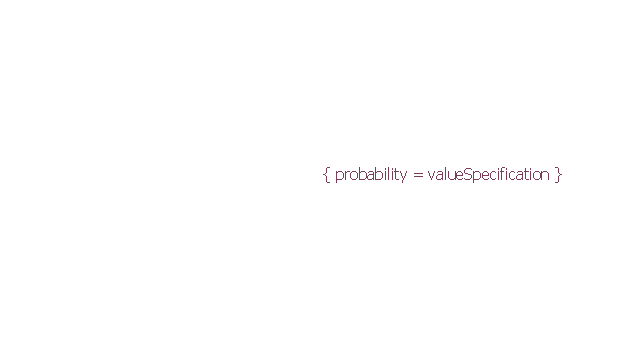
Probability
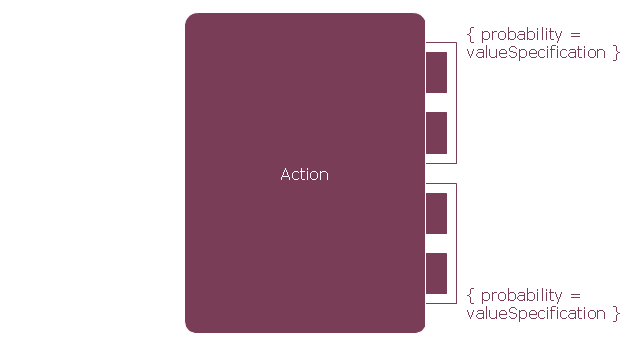
Probability 2
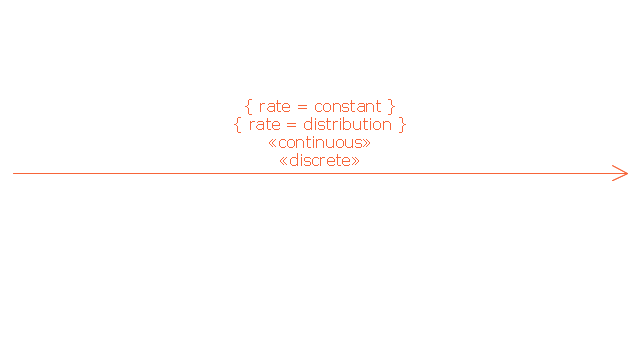
Rate
Rate 2
Rate 3
Rate 4
Rate 5
Rate 6
Control flow
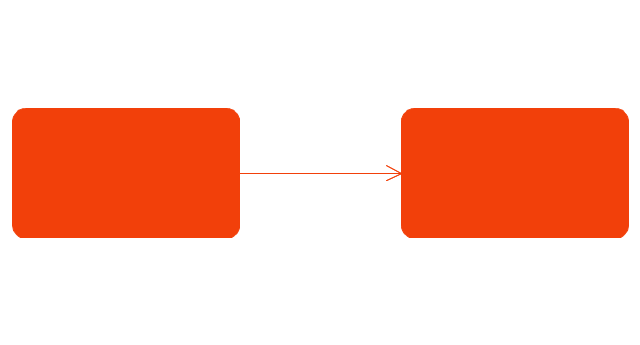
Control flow 2

Object flow
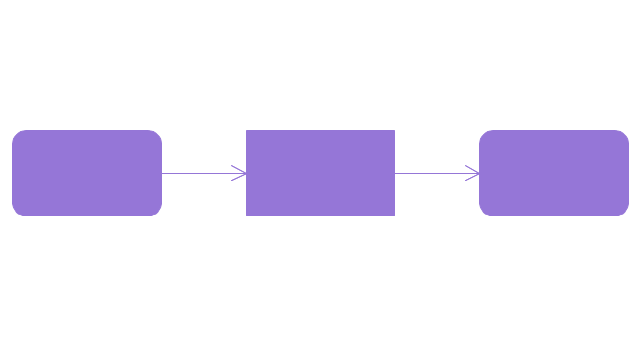
Object flow 2
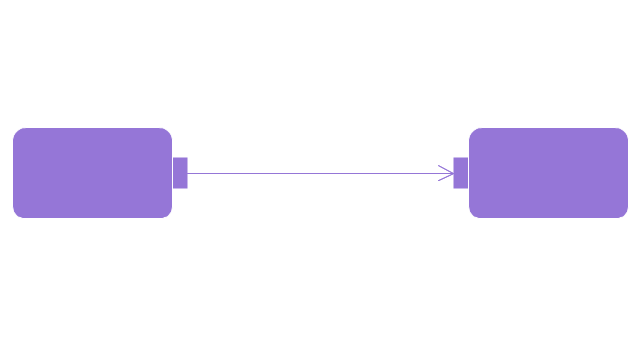
Probability path
Rate path
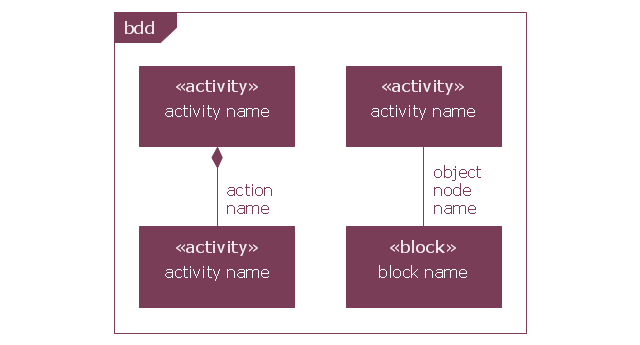
In block definition diagram, activity, association
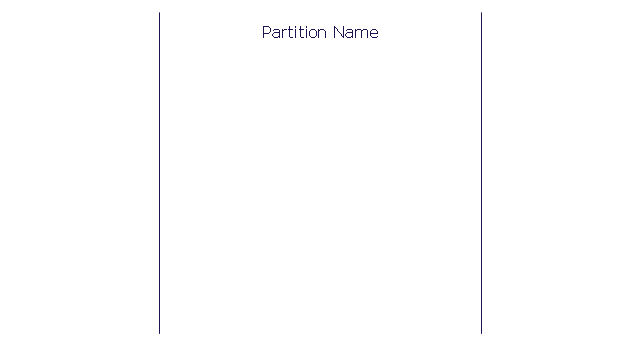
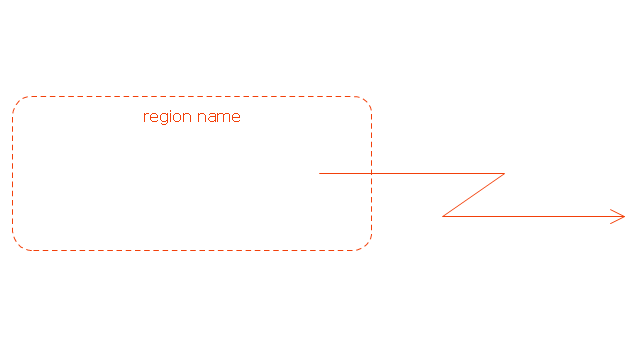
Activity partition
Activity partition - action
Interruptible activity region
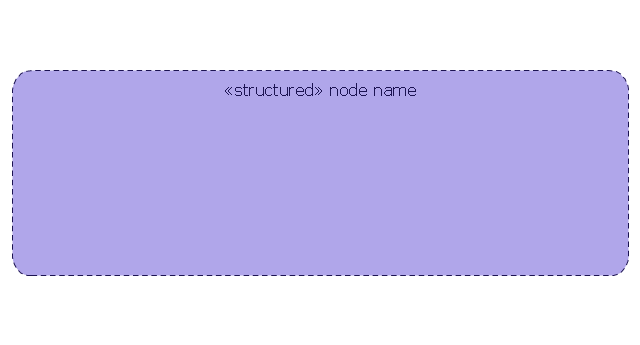
Structured activity node
HelpDesk
How to Create an IDEF0 Diagram for an Application Development

HelpDesk
How to Create a BPMN Diagram Using ConceptDraw PRO

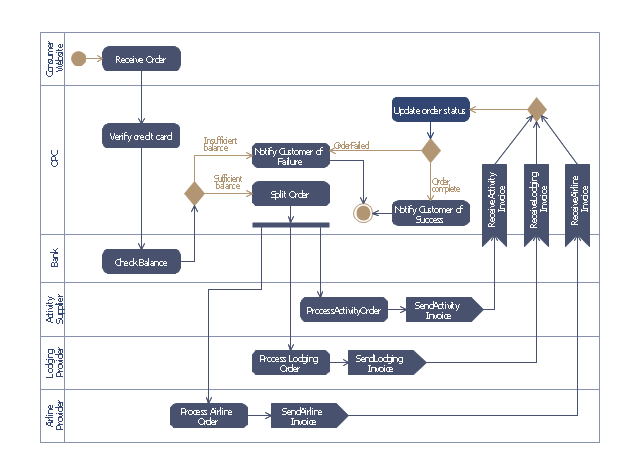
This purchase order processing UML activity diagram was created on the base of activity diagram from the software architecture documentation wiki of the Software Engineering Institute (SEI) of Carnegie Mellon University (CMU).
[wiki.sei.cmu.edu/ sad/ index.php/ Image:PurchaseOrderActivityDiagram.png]
"A purchase order (PO) is a commercial document and first official offer issued by a buyer to a seller, indicating types, quantities, and agreed prices for products or services. Acceptance of a purchase order by a seller forms a contract between the buyer and seller, so no contract exists until the purchase order is accepted. It is used to control the purchasing of products and services from external suppliers.
Creating a purchase order is typically the first step of the purchase to pay process in an ERP system." [Purchase order. Wikipedia]
This purchase order processing UML activity diagram example was created using the ConceptDraw PRO diagramming and vector drawing software extended with the ATM UML Diagrams solution from the Software Development area of ConceptDraw Solution Park.
UML activity diagram of purchase order processing
 Circular Arrows Diagrams
Circular Arrows Diagrams solution extends ConceptDraw PRO v10 with extensive drawing tools, predesigned samples, Circular flow diagram template for quick start, and a library of ready circular arrow vector stencils for drawing Circular Arrow Diagrams, Segmented Cycle Diagrams, and Circular Flow Diagrams. The elements in this solution help managers, analysts, business advisers, marketing experts, scientists, lecturers, and other knowledge workers in their daily work.
- Activity on Node Network Diagramming Tool | Network Analysis ...
- Activity Network Diagram Method | Activity on Node Network ...
- Process Flowchart | Activity on Node Network Diagramming Tool ...
- Activity on Node Network Diagramming Tool | ConceptDraw PRO ...
- How To Draw The Activity Node Diagram
- Activity Network (PERT) Chart | Activity Network Diagram Method ...
- Network Analysis Activity on Node | Activity on Node Network ...
- Activity On Arrow Diagram Generator
- Network Diagram Examples | Network Diagram Software (PRO ...
- Activity on Node Network Diagramming Tool | Activity Network ...
- Computer Network Diagrams | Cisco Network Templates | PERT ...
- How To Create a PERT Chart | Activity Network Diagram Method ...
- Activity on Node Network Diagramming Tool | Program Evaluation ...
- Activity on Node Network Diagramming Tool | PERT chart ...
- Activity On Node Diagram Generator
- Examples of Flowcharts, Org Charts and More | ConceptDraw PRO ...
- ConceptDraw PRO Network Diagram Tool | Activity on Node ...
- How To Create the Affinity Diagram | Activity on Node Network ...
- Examples of Flowcharts, Org Charts and More | Cisco Network ...
- Network Diagramming Software for Design Cisco Network Diagrams ...