The vector stencils library "Weather" contains 17 weather clipart images for drawing illustrations on climate to show cloudiness, air temperature, precipitation, wind.
"Weather is the state of the atmosphere, to the degree that it is hot or cold, wet or dry, calm or stormy, clear or cloudy. Most weather phenomena occur in the troposphere, just below the stratosphere. Weather generally refers to day-to-day temperature and precipitation activity, whereas climate is the term for the average atmospheric conditions over longer periods of time. When used without qualification, "weather", is generally understood to mean the weather of Earth.
Weather is driven by air pressure (temperature and moisture) differences between one place and another. These pressure and temperature differences can occur due to the sun angle at any particular spot, which varies by latitude from the tropics. The strong temperature contrast between polar and tropical air gives rise to the jet stream. Weather systems in the mid-latitudes, such as extratropical cyclones, are caused by instabilities of the jet stream flow. Because the Earth's axis is tilted relative to its orbital plane, sunlight is incident at different angles at different times of the year. On Earth's surface, temperatures usually range ±40°C (−40°F to 100°F) annually. Over thousands of years, changes in Earth's orbit affect the amount and distribution of solar energy received by the Earth and influence long-term climate and global climate change." [Weather. Wikipedia]
The clip art example "Weather - Vector stencils library" was created using the ConceptDraw PRO diagramming and vector drawing software extended with the Nature solution from the Illustration area of ConceptDraw Solution Park.
www.conceptdraw.com/ solution-park/ illustrations-nature
Sunny

Cloudy

Overcast

Snow

Rain

Lightning

Hot

Warm

Frost

Mist

Strong wind

Flood

Tsunami

Dew

Hoar-frost

Earthquake

Snowflake

The vector stencils library "Lighting" contains 55 symbols of lighting devices and equipment.
Use these shapes for drawing lighting design floor plans, circuit schematic and wiring diagrams, cabling layouts, and reflected ceiling plans in the ConceptDraw PRO diagramming and vector drawing software.
The vector stencils library "Lighting" is included in the Electric and Telecom Plans solution from the Building Plans area of ConceptDraw Solution Park.
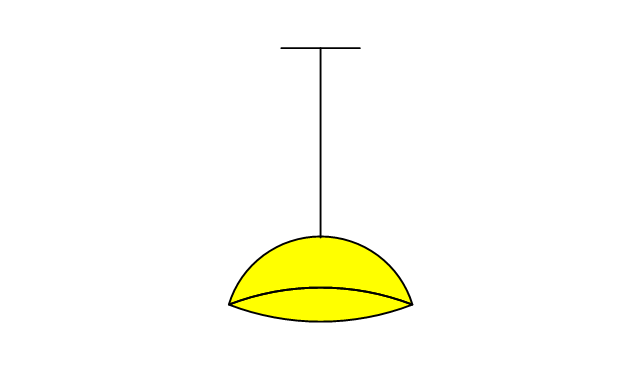
Luminaire ceiling mount
Enclosed ceiling luminaire
Wall light
Down lighter
Outdoor lightning
Outdoor lightning, bollard
1-light bar
2-light bar
4-light bar
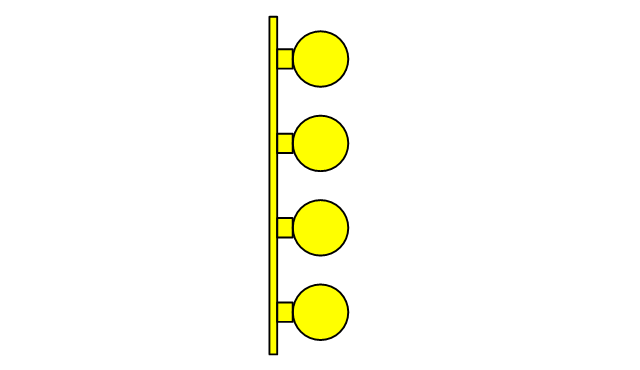
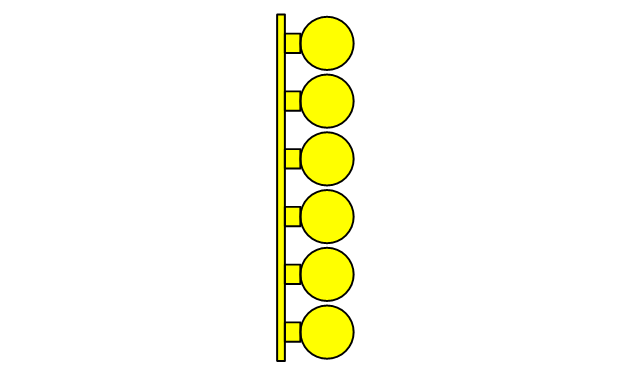
6-light bar
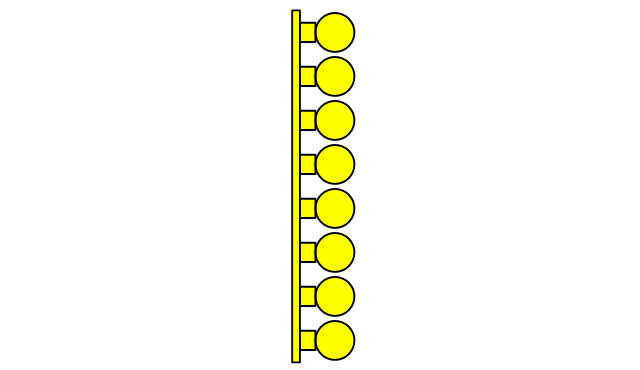
8-light bar
Batten fluorescent, 1 lamp
Batten fluorescent, 2 lamps
Batten fluorescent, 3 lamps
Batten fluorescent, 4 lamps
Surface Fluorescent Light
Modular fluorescent fitting
Modular fluorescent fitting, inverter
Modular fluorescent fitting 2
Emergency light

Emergency light 2
Emergency sign
Emergency Light, Recessed
Light, Surface Mounted
Ceiling Light Outlet
Recessed Ceiling Light
Ceiling Fan
Ceiling Light with Pull Cord
Weatherproof Landscape Light
Wall Light Outlet
Control Keypad
Emergency Battery Unit
Emergency Battery Unit with two Lights
Emergency Single Light, Remote Mounted
Emergency Duplex Light, Remote Mounted
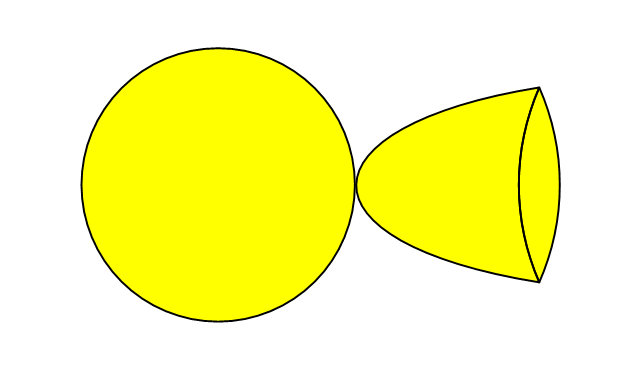
Spotlight, Single Head
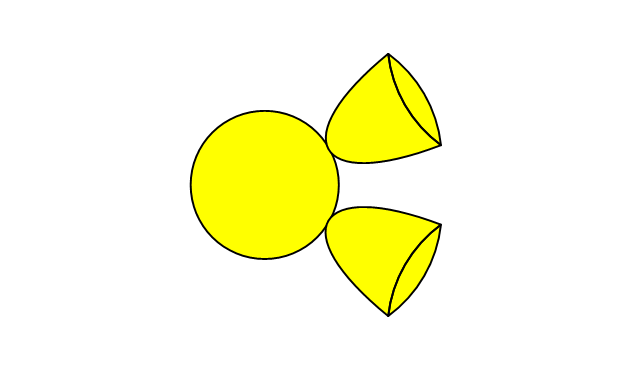
Spotlight, Double Head
Exit Sign, Pendant Mounted
Exit Sign, Wall Mounted
Light, Pole Mounted
Light Flood, Pole Mounted
Light Flood, Wall Mounted
Light, Stanchion Mounted
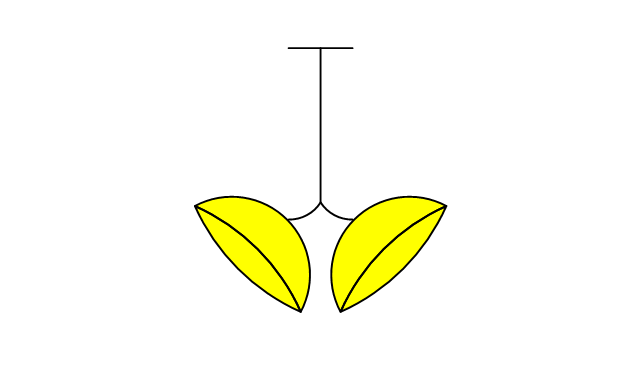
Twin Lights, Pendant Mounted
Inground Light, Floor Mounted
Suspended Light
Suspended Lights
Integrated Light
Lights, Track Mounted
Night Light
Roadway Light, Cobra Head
Louvers
Light, Directional Accent
Light, Directional Aiming Line
Light, Directional Arrow
The vector stencils library "Lighting" contains 55 symbols of lighting devices and equipment.
Use these shapes for drawing lighting design floor plans, circuit schematic and wiring diagrams, cabling layouts, and reflected ceiling plans in the ConceptDraw PRO diagramming and vector drawing software.
The vector stencils library "Lighting" is included in the Electric and Telecom Plans solution from the Building Plans area of ConceptDraw Solution Park.
Use these shapes for drawing lighting design floor plans, circuit schematic and wiring diagrams, cabling layouts, and reflected ceiling plans in the ConceptDraw PRO diagramming and vector drawing software.
The vector stencils library "Lighting" is included in the Electric and Telecom Plans solution from the Building Plans area of ConceptDraw Solution Park.
Luminaire ceiling mount
Enclosed ceiling luminaire
Wall light
Down lighter
Outdoor lightning
Outdoor lightning, bollard
1-light bar
2-light bar
4-light bar
6-light bar
8-light bar
Batten fluorescent, 1 lamp
Batten fluorescent, 2 lamps
Batten fluorescent, 3 lamps
Batten fluorescent, 4 lamps
Surface Fluorescent Light
Modular fluorescent fitting
Modular fluorescent fitting, inverter
Modular fluorescent fitting 2
Emergency light
Emergency light 2
Emergency sign
Emergency Light, Recessed
Light, Surface Mounted
Ceiling Light Outlet
Recessed Ceiling Light
Ceiling Fan
Ceiling Light with Pull Cord
Weatherproof Landscape Light
Wall Light Outlet
Control Keypad
Emergency Battery Unit
Emergency Battery Unit with two Lights
Emergency Single Light, Remote Mounted
Emergency Duplex Light, Remote Mounted
Spotlight, Single Head
Spotlight, Double Head
Exit Sign, Pendant Mounted
Exit Sign, Wall Mounted
Light, Pole Mounted
Light Flood, Pole Mounted
Light Flood, Wall Mounted
Light, Stanchion Mounted
Twin Lights, Pendant Mounted
Inground Light, Floor Mounted
Suspended Light
Suspended Lights
Integrated Light
Lights, Track Mounted
Night Light
Roadway Light, Cobra Head
Louvers
Light, Directional Accent
Light, Directional Aiming Line
Light, Directional Arrow
The vector stencils library "Weather" contains 17 weather clipart images for drawing illustrations on climate to show cloudiness, air temperature, precipitation, wind.
"Weather is the state of the atmosphere, to the degree that it is hot or cold, wet or dry, calm or stormy, clear or cloudy. Most weather phenomena occur in the troposphere, just below the stratosphere. Weather generally refers to day-to-day temperature and precipitation activity, whereas climate is the term for the average atmospheric conditions over longer periods of time. When used without qualification, "weather", is generally understood to mean the weather of Earth.
Weather is driven by air pressure (temperature and moisture) differences between one place and another. These pressure and temperature differences can occur due to the sun angle at any particular spot, which varies by latitude from the tropics. The strong temperature contrast between polar and tropical air gives rise to the jet stream. Weather systems in the mid-latitudes, such as extratropical cyclones, are caused by instabilities of the jet stream flow. Because the Earth's axis is tilted relative to its orbital plane, sunlight is incident at different angles at different times of the year. On Earth's surface, temperatures usually range ±40°C (−40°F to 100°F) annually. Over thousands of years, changes in Earth's orbit affect the amount and distribution of solar energy received by the Earth and influence long-term climate and global climate change." [Weather. Wikipedia]
The clip art example "Weather - Vector stencils library" was created using the ConceptDraw PRO diagramming and vector drawing software extended with the Nature solution from the Illustration area of ConceptDraw Solution Park.
www.conceptdraw.com/ solution-park/ illustrations-nature
"Weather is the state of the atmosphere, to the degree that it is hot or cold, wet or dry, calm or stormy, clear or cloudy. Most weather phenomena occur in the troposphere, just below the stratosphere. Weather generally refers to day-to-day temperature and precipitation activity, whereas climate is the term for the average atmospheric conditions over longer periods of time. When used without qualification, "weather", is generally understood to mean the weather of Earth.
Weather is driven by air pressure (temperature and moisture) differences between one place and another. These pressure and temperature differences can occur due to the sun angle at any particular spot, which varies by latitude from the tropics. The strong temperature contrast between polar and tropical air gives rise to the jet stream. Weather systems in the mid-latitudes, such as extratropical cyclones, are caused by instabilities of the jet stream flow. Because the Earth's axis is tilted relative to its orbital plane, sunlight is incident at different angles at different times of the year. On Earth's surface, temperatures usually range ±40°C (−40°F to 100°F) annually. Over thousands of years, changes in Earth's orbit affect the amount and distribution of solar energy received by the Earth and influence long-term climate and global climate change." [Weather. Wikipedia]
The clip art example "Weather - Vector stencils library" was created using the ConceptDraw PRO diagramming and vector drawing software extended with the Nature solution from the Illustration area of ConceptDraw Solution Park.
www.conceptdraw.com/ solution-park/ illustrations-nature
Sunny
Cloudy
Overcast
Snow
Rain
Lightning
Hot
Warm
Frost
Mist
Strong wind
Flood
Tsunami
Dew
Hoar-frost
Earthquake
Snowflake
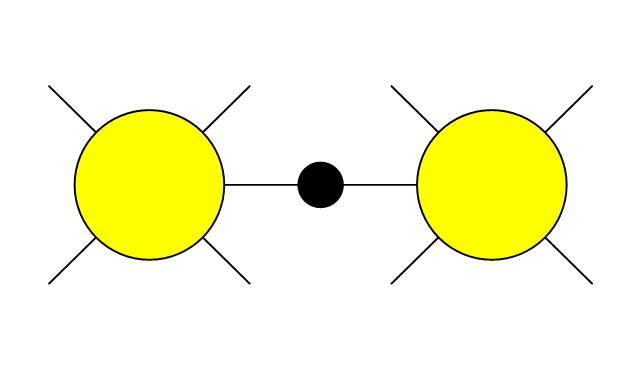
Mesh Network Topology Diagram

The Mesh Network Topology Diagram examples was created using ConceptDraw PRO software with Computer and Networks solution.
The vector stencils library Weather contains 17 symbols of meteorological conditions: sunny, cloudy, overcast, snow, rain, lighting, hot, warm, cold, mist, strong wind, flood, tsunami, dew, hoarfrost, earthquake, snowflake.
Use the design elements library Weather to draw illustrations, calendars, maps and infographics with weather phenomena clipart using the ConceptDraw PRO diagramming and vector graphics software.
"Weather is the state of the atmosphere, to the degree that it is hot or cold, wet or dry, calm or stormy, clear or cloudy. Most weather phenomena occur in the troposphere, just below the stratosphere. Weather generally refers to day-to-day temperature and precipitation activity, whereas climate is the term for the average atmospheric conditions over longer periods of time. When used without qualification, "weather" is understood to mean the weather of Earth." [Weather. Wikipedia]
This example of weather clipart is included in the Nature solution from the Illustration area of ConceptDraw Solution Park.
Vector clip art

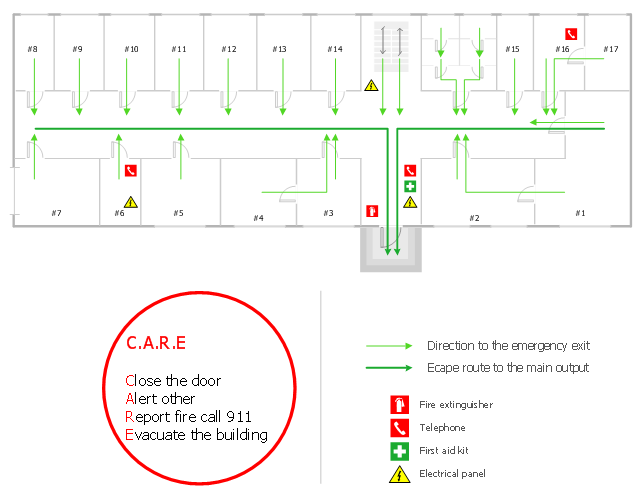
"Emergency evacuation is the immediate and urgent movement of people away from the threat or actual occurrence of a hazard. Examples range from the small scale evacuation of a building due to a storm or fire to the large scale evacuation of a district because of a flood, bombardment or approaching weather system. In situations involving hazardous materials or possible contamination, evacuees may be decontaminated prior to being transported out of the contaminated area. ...
Planning.
Emergency evacuation plans are developed to ensure the safest and most efficient evacuation time of all expected residents of a structure, city, or region. A benchmark "evacuation time" for different hazards and conditions is established. These benchmarks can be established through using best practices, regulations, or using simulations, such as modeling the flow of people in a building, to determine the benchmark. Proper planning will use multiple exits, contra-flow lanes, and special technologies to ensure full, fast and complete evacuation. Consideration for personal situations which may affect an individual's ability to evacuate is taken into account, including alarm signals that use both aural and visual alerts, and also evacuation equipment such as sleds, pads, and chairs for non-ambulatory people. Regulations such as building codes can be used to reduce the possibility of panic by allowing individuals to process the need to self-evacuate without causing alarm. Proper planning will implement an all-hazards approach so that plans can be reused for multiple hazards that could exist." [Emergency evacuation. Wikipedia]
The evacuation plan example was created using the ConceptDraw PRO diagramming and vector drawing software extended with the Fire and Emergency Plans solution from the Building Plans area of ConceptDraw Solution Park.
Fire protection scheme
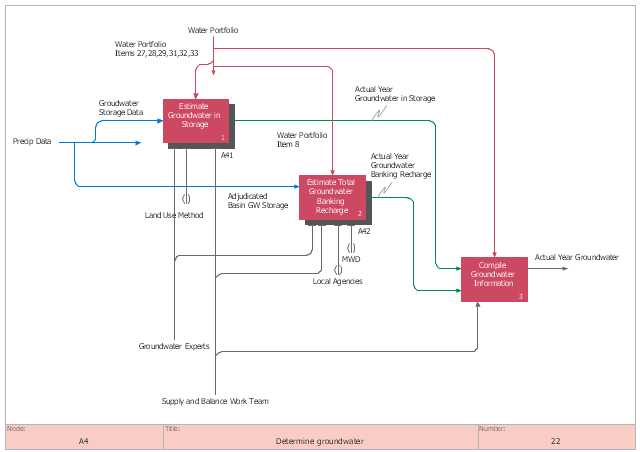
This IDEF0 diagram sample was created on the base of the figure from the California Water Plan website. [waterplan.water.ca.gov/ technical/ cwpu2009/ flowdiaghtml/ dgm18.htm]
"The California Water Plan provides a collaborative planning framework for elected officials, agencies, tribes, water and resource managers, businesses, academia, stakeholders, and the public to develop findings and recommendations and make informed decisions for California's water future. The plan, updated every five years, presents the status and trends of California's water-dependent natural resources; water supplies; and agricultural, urban, and environmental water demands for a range of plausible future scenarios. The California Water Plan also evaluates different combinations of regional and statewide resource management strategies to reduce water demand, increase water supply, reduce flood risk, improve water quality, and enhance environmental and resource stewardship. The evaluations and assessments performed for the plan help identify effective actions and policies for meeting California's resource management objectives in the near term and for several decades to come." [waterplan.water.ca.gov]
The IDEF0 diagram example "Determine groundwater" was created using the ConceptDraw PRO diagramming and vector drawing software extended with the IDEF0 Diagrams solution from the Software Development area of ConceptDraw Solution Park.
IDEF0 diagram
The vector stencils library "Lighting" contains 55 symbols of lighting devices and equipment.
Use these shapes for drawing lighting design floor plans, circuit schematic and wiring diagrams, cabling layouts, and reflected ceiling plans in the ConceptDraw PRO diagramming and vector drawing software.
The vector stencils library "Lighting" is included in the Electric and Telecom Plans solution from the Building Plans area of ConceptDraw Solution Park.
Use these shapes for drawing lighting design floor plans, circuit schematic and wiring diagrams, cabling layouts, and reflected ceiling plans in the ConceptDraw PRO diagramming and vector drawing software.
The vector stencils library "Lighting" is included in the Electric and Telecom Plans solution from the Building Plans area of ConceptDraw Solution Park.
Luminaire ceiling mount
Enclosed ceiling luminaire
Wall light
Down lighter
Outdoor lightning
Outdoor lightning, bollard
1-light bar
2-light bar
4-light bar
6-light bar
8-light bar
Batten fluorescent, 1 lamp
Batten fluorescent, 2 lamps
Batten fluorescent, 3 lamps
Batten fluorescent, 4 lamps
Surface Fluorescent Light
Modular fluorescent fitting
Modular fluorescent fitting, inverter
Modular fluorescent fitting 2
Emergency light
Emergency light 2
Emergency sign
Emergency Light, Recessed
Light, Surface Mounted
Ceiling Light Outlet
Recessed Ceiling Light
Ceiling Fan
Ceiling Light with Pull Cord
Weatherproof Landscape Light
Wall Light Outlet
Control Keypad
Emergency Battery Unit
Emergency Battery Unit with two Lights
Emergency Single Light, Remote Mounted
Emergency Duplex Light, Remote Mounted
Spotlight, Single Head
Spotlight, Double Head
Exit Sign, Pendant Mounted
Exit Sign, Wall Mounted
Light, Pole Mounted
Light Flood, Pole Mounted
Light Flood, Wall Mounted
Light, Stanchion Mounted
Twin Lights, Pendant Mounted
Inground Light, Floor Mounted
Suspended Light
Suspended Lights
Integrated Light
Lights, Track Mounted
Night Light
Roadway Light, Cobra Head
Louvers
Light, Directional Accent
Light, Directional Aiming Line
Light, Directional Arrow
This flow chart sample was drawn on the base on the illustration of the article "Climate change impact on China food security in 2050" from the website of Chinese Academy of Agricultural Sciences .
[caas.cn/ en/ newsroom/ research_ update/ 67347.shtml]
"Food security is a condition related to the ongoing availability of food. ...
According to the Food and Agriculture Organization (FAO), food security "exists when all people, at all times, have physical and economic access to sufficient, safe and nutritious food to meet their dietary needs and food preferences for an active and healthy life". ...
Extreme events, such as droughts and floods, are forecast to increase as climate change takes hold. Ranging from overnight floods to gradually worsening droughts, these will have a range of impacts on the agricultural sector. ...
According to the Climate & Development Knowledge Network report Managing Climate Extremes and Disasters in the Agriculture Sectors: Lessons from the IPCC SREX Report, the impacts will include changing productivity and livelihood patterns, economic losses, and impacts on infrastructure, markets and food security. Food security in future will be linked to our ability to adapt agricultural systems to extreme events." [Food security. Wikipedia]
The flowchart example "Food security assessment" was created using the ConceptDraw PRO diagramming and vector drawing software extended with the Flowcharts solution from the area "What is a Diagram" of ConceptDraw Solution Park.
Flowchart

How To Create Restaurant Floor Plan in Minutes

It helps make a layout for a restaurant — restaurant floor plans, cafe floor plans, bar area, floor plan of a fast food restaurant, restaurant furniture layout, etc.
ConceptDraw PRO — great restaurant floor planner. You do not need to be an artist to create great-looking restaurant floor plans in minutes.

The vector stencils library "Weather" contains 17 weather clipart images for drawing illustrations on climate to show cloudiness, air temperature, precipitation, wind.
"Weather is the state of the atmosphere, to the degree that it is hot or cold, wet or dry, calm or stormy, clear or cloudy. Most weather phenomena occur in the troposphere, just below the stratosphere. Weather generally refers to day-to-day temperature and precipitation activity, whereas climate is the term for the average atmospheric conditions over longer periods of time. When used without qualification, "weather", is generally understood to mean the weather of Earth.
Weather is driven by air pressure (temperature and moisture) differences between one place and another. These pressure and temperature differences can occur due to the sun angle at any particular spot, which varies by latitude from the tropics. The strong temperature contrast between polar and tropical air gives rise to the jet stream. Weather systems in the mid-latitudes, such as extratropical cyclones, are caused by instabilities of the jet stream flow. Because the Earth's axis is tilted relative to its orbital plane, sunlight is incident at different angles at different times of the year. On Earth's surface, temperatures usually range ±40°C (−40°F to 100°F) annually. Over thousands of years, changes in Earth's orbit affect the amount and distribution of solar energy received by the Earth and influence long-term climate and global climate change." [Weather. Wikipedia]
The clip art example "Weather - Vector stencils library" was created using the ConceptDraw PRO diagramming and vector drawing software extended with the Nature solution from the Illustration area of ConceptDraw Solution Park.
www.conceptdraw.com/ solution-park/ illustrations-nature
"Weather is the state of the atmosphere, to the degree that it is hot or cold, wet or dry, calm or stormy, clear or cloudy. Most weather phenomena occur in the troposphere, just below the stratosphere. Weather generally refers to day-to-day temperature and precipitation activity, whereas climate is the term for the average atmospheric conditions over longer periods of time. When used without qualification, "weather", is generally understood to mean the weather of Earth.
Weather is driven by air pressure (temperature and moisture) differences between one place and another. These pressure and temperature differences can occur due to the sun angle at any particular spot, which varies by latitude from the tropics. The strong temperature contrast between polar and tropical air gives rise to the jet stream. Weather systems in the mid-latitudes, such as extratropical cyclones, are caused by instabilities of the jet stream flow. Because the Earth's axis is tilted relative to its orbital plane, sunlight is incident at different angles at different times of the year. On Earth's surface, temperatures usually range ±40°C (−40°F to 100°F) annually. Over thousands of years, changes in Earth's orbit affect the amount and distribution of solar energy received by the Earth and influence long-term climate and global climate change." [Weather. Wikipedia]
The clip art example "Weather - Vector stencils library" was created using the ConceptDraw PRO diagramming and vector drawing software extended with the Nature solution from the Illustration area of ConceptDraw Solution Park.
www.conceptdraw.com/ solution-park/ illustrations-nature
Sunny
Cloudy
Overcast
Snow
Rain
Lightning
Hot
Warm
Frost
Mist
Strong wind
Flood
Tsunami
Dew
Hoar-frost
Earthquake
Snowflake
Wireless Network Drawing

ConceptDraw PRO is well placed to provide experienced and comprehensive assistance in the workplace.
The vector stencils, examples, and templates included to solution is a strong toolset for network engineer.
Mesh Network. Computer and Network Examples

This example was created in ConceptDraw PRO using the Computer and Networks solution from the Computer and Networks area of ConceptDraw Solution Park and shows the Mesh Network.

Network Topologies

Easy to draw network topology, physical network, logical network, network mapping, home area networks (HAN), wireless network, cisco network topologies, fully connected network topology, bus network topology, star network topology, ring network topology, mesh network topology, tree network topology.

- Flood
- Light Flood , Wall Mounted
- Light Flood
- Flood
- Directional Aiming Line
- Pendant Mounted
- Lighting - Vector stencils library | Fire Exit Plan. Building Plan ...
- Directional Accent
- Recessed Ceiling Light
- Integrated Light
- Suspended Light
- Emergency Lighting Symbols
- Spotlight
- Lighting - Vector stencils library | Design elements - Lighting ...
- Remote Mounted
- Lighting - Vector stencils library | How to Uninstall ConceptDraw ...
- Multi Light Bar
- Workflow diagram - Weather forecast | How can you illustrate the ...
- Lighting - Vector stencils library | Interior Design Site Plan - Design ...
- Weather - Vector stencils library
- ERD | Entity Relationship Diagrams, ERD Software for Mac and Win
- Flowchart | Basic Flowchart Symbols and Meaning
- Flowchart | Flowchart Design - Symbols, Shapes, Stencils and Icons
- Flowchart | Flow Chart Symbols
- Electrical | Electrical Drawing - Wiring and Circuits Schematics
- Flowchart | Common Flowchart Symbols
- Flowchart | Common Flowchart Symbols