 Winter Sports
The Winter Sports solution from Sport area of ConceptDraw Solution Park contains winter sports illustration examples, templates and vector clipart libraries.
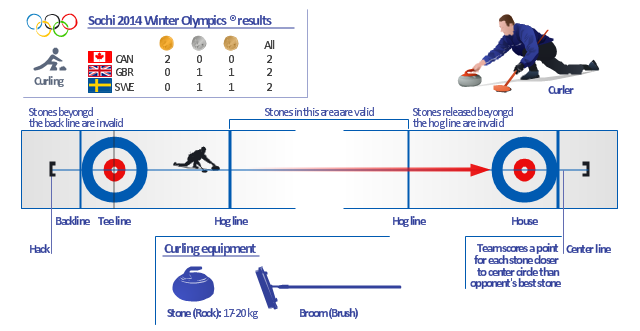
The example infographics "Curling sheet" shows Sochi 2014 Winter Olympics curling medal table, curing sheet scheme, curler and game equipment clipart images.
"The curling competition of the 2014 Winter Olympics was held at the Ice Cube Curling Center, nicknamed "the Ice Cube". It is the sixth time that curling was on the Olympic program. In both the men's and women's competitions, ten nations competed. These two events took place between 10–21 February 2014." [Curling at the 2014 Winter Olympics. Wikipedia]
The sport infographics example "Curling sheet" is created using the ConceptDraw PRO diagramming and vector drawing software extended with the Winter Sports solution from the Sport area of ConceptDraw Solution Park.
Sochi 2014 Winter Olympics curling results - Sport infographics
The vector stencils library "Winter Olympics pictograms" contains 29 pictograms and silhouettes.
Use it for drawing Winter Olympics diagrams, infographics and illustrations in the ConceptDraw PRO diagramming and vector drawing software extended with the Winter Sports solution from the Sport area of ConceptDraw Solution Park.
Use it for drawing Winter Olympics diagrams, infographics and illustrations in the ConceptDraw PRO diagramming and vector drawing software extended with the Winter Sports solution from the Sport area of ConceptDraw Solution Park.
Olympic rings
Olympic torch

Olympic medal pedestal
Olympic medal, gold

Olympic medal, silver

Olympic medal, bronze

Olympic medal with ribbon, gold

Olympic medal with ribbon, silver

Olympic medal with ribbon, bronze

Skis
Ski poles
Biathlon rifle
Snowboard

Ski goggles
Ski gloves

Ice hockey helmet

Hockey stick
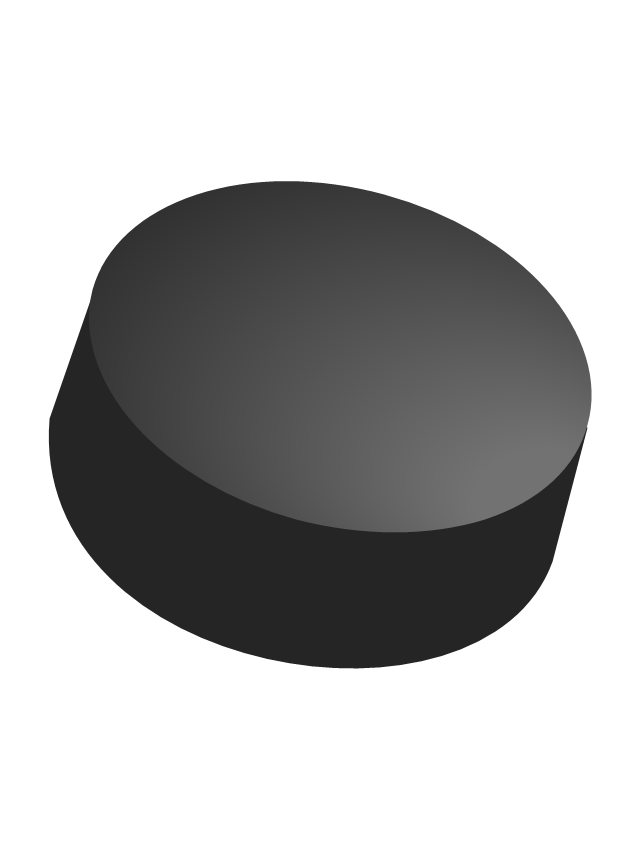
Hockey puck
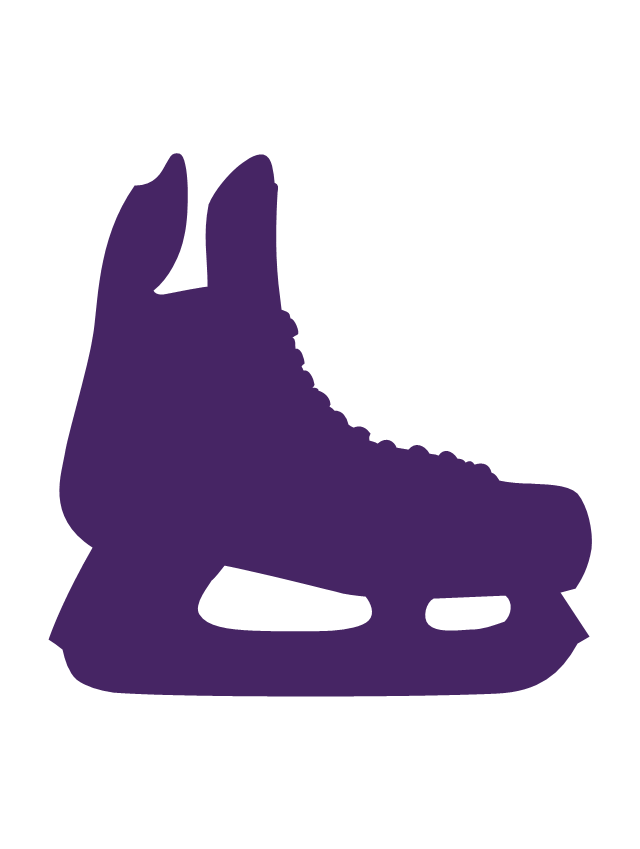
Ice hockey skates
Ice skates

Luge

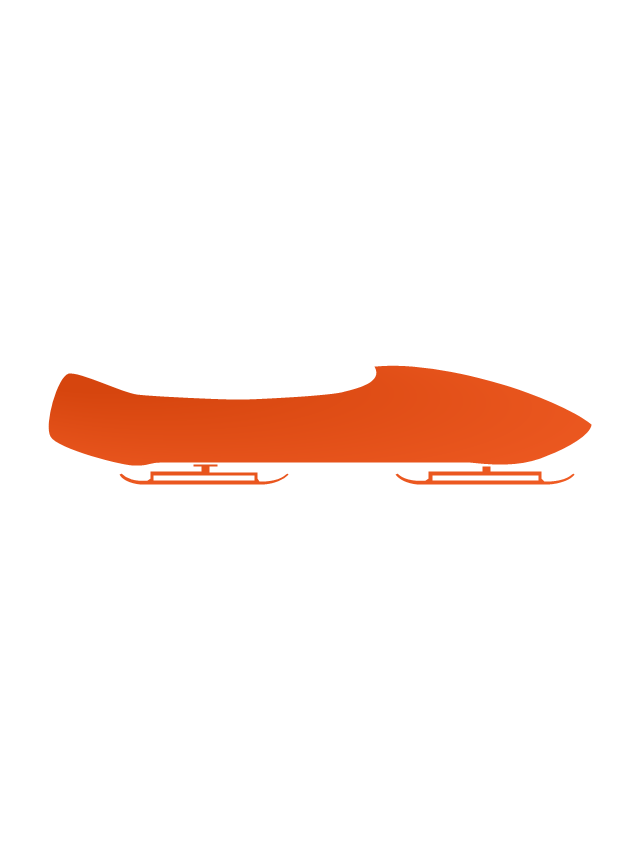
Bobsleigh sled
Curling stone

Curling broom

Mountains

Mountains 2

Snowflake

Fir-tree

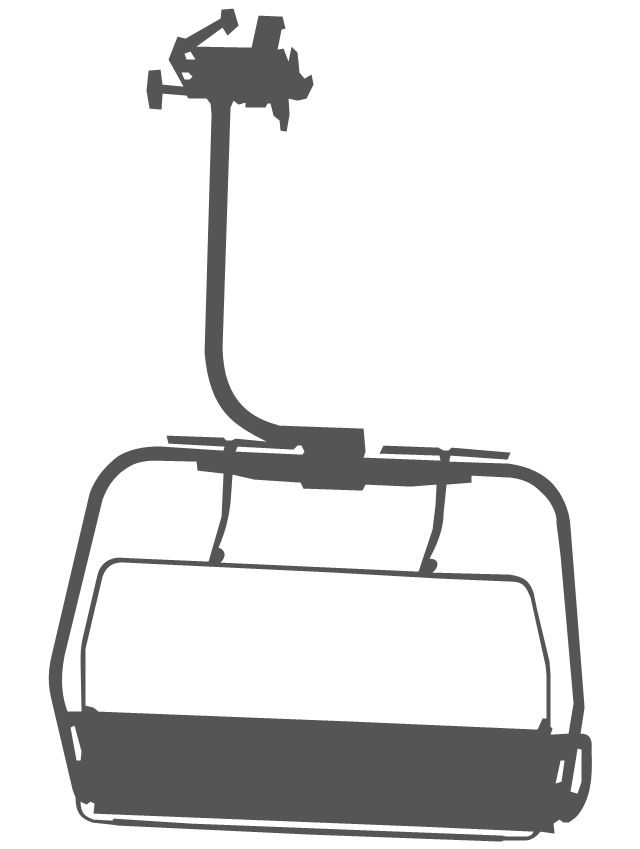
Ski lift
Flowchart

Design Pictorial Infographics. Design Infographics

- Curling sheet | Winter Sports | Diagram Of Curling Sheet
- Wheelchair curling - Winter sports pictograms | Curling sheet ...
- Wheelchair curling - Winter sports pictograms | Curling - Winter ...
- Curling sheet | Wheelchair curling - Winter sports pictograms ...
- Winter Olympic Curling Pictogram
- Sport pictograms. Olympic Games | Winter Olympics pictograms ...
- Geography - Vector stencils library | Wheelchair curling - Winter ...
- Curling Vector Illustration
- Winter Sports | Winter Sports . Olympic Games Infographics. Medal ...
- Winter Sports Vector Clipart. Medal Map. Spatial Infographics ...
- Snowboard - Winter sports pictograms | Design elements - Winter ...
- Figure skating - Winter sports pictograms | Winter sports pictograms ...
- Sport pictograms. Olympic Games | Speed skating - Winter sports ...
- Winter Sports . Olympic Games Illustrations. Medal Summary | Winter ...
- Winter Sports . Olympic Games Infographics. Medal Table | Winter ...
- Sochi 2014 Olympics - Men's hockey tournament schedule ...
- Winter Sports | Winter Olympics - Vector stencils library | Sochi 2014 ...
- Sport pictograms. Olympic Games | Design elements - Winter ...
- Ice Hockey Rink Dimensions | Soccer (Football) Dimensions | Ice ...
- Winter Sports Vector Clipart. Medal Map. Spatial Infographics ...
- ERD | Entity Relationship Diagrams, ERD Software for Mac and Win
- Flowchart | Basic Flowchart Symbols and Meaning
- Flowchart | Flowchart Design - Symbols, Shapes, Stencils and Icons
- Flowchart | Flow Chart Symbols
- Electrical | Electrical Drawing - Wiring and Circuits Schematics
- Flowchart | Common Flowchart Symbols
- Flowchart | Common Flowchart Symbols