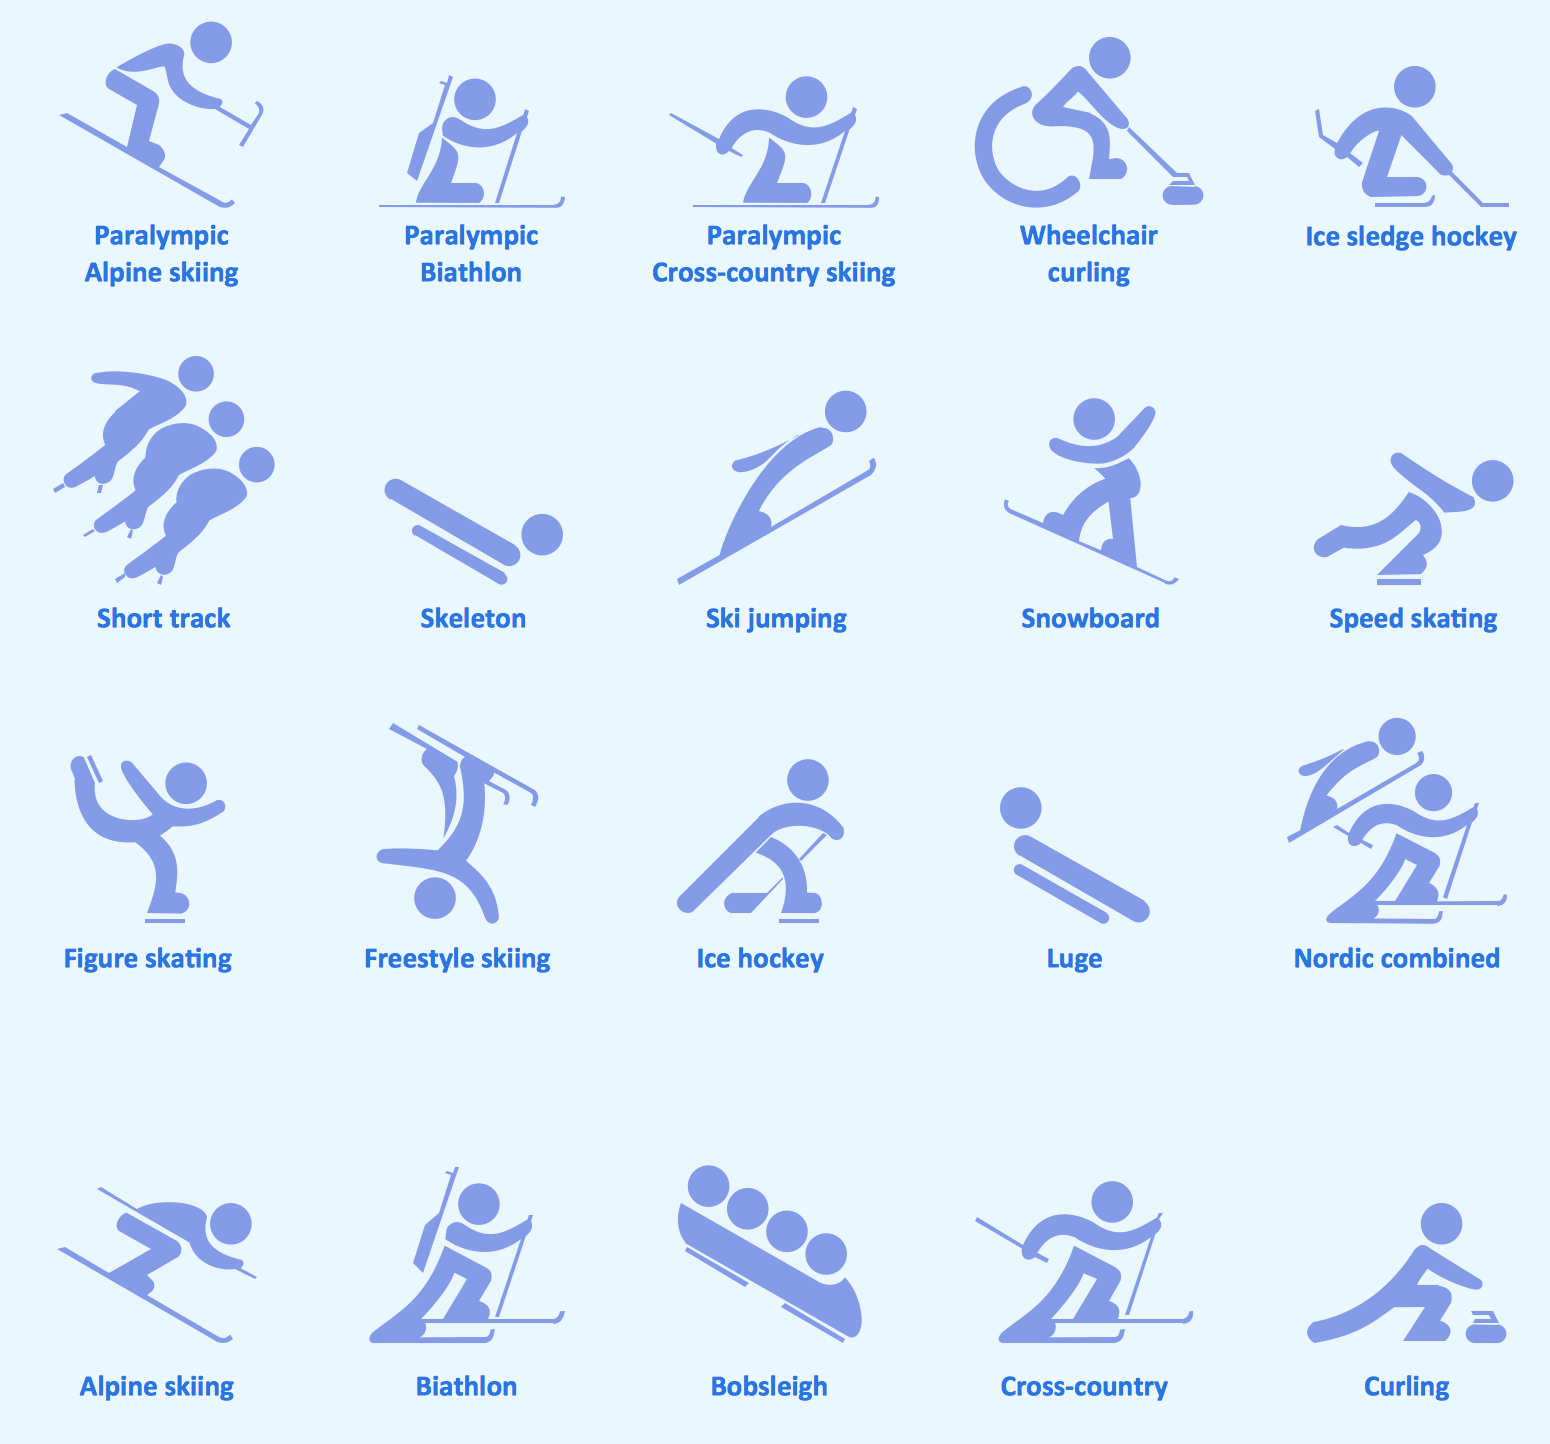
Sport pictograms. Olympic Games
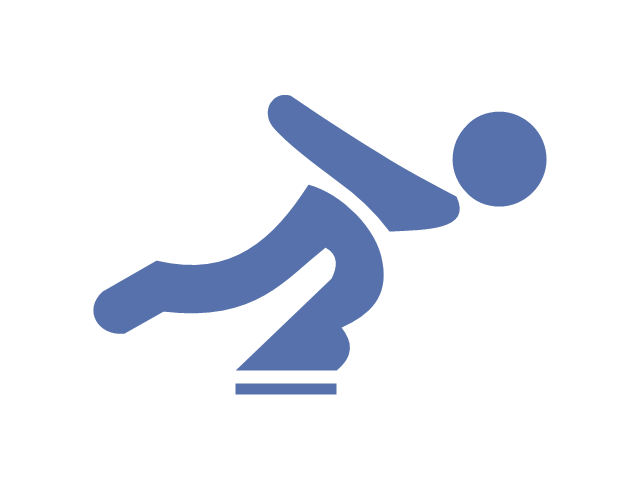
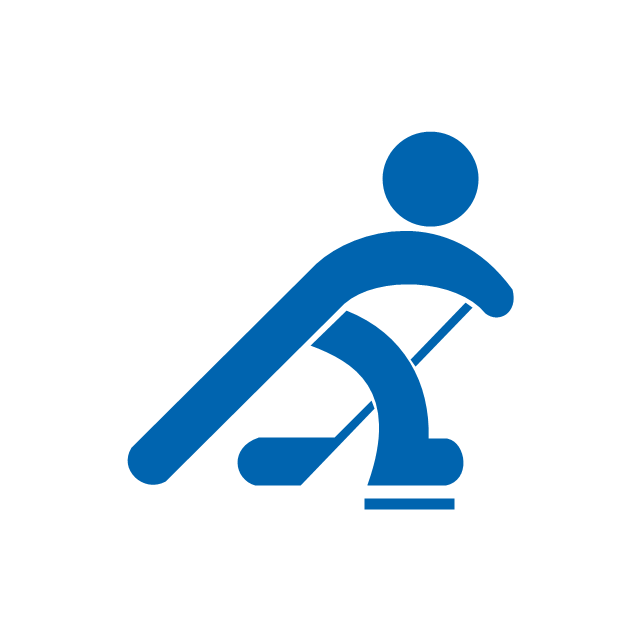
"Speed skating, or speedskating, is a competitive form of ice skating in which the competitors race each other in traveling a certain distance on skates. Types of speed skating are long track speed skating, short track speed skating, and marathon speed skating. In the Olympic Games, long-track speed skating is usually referred to as just "speed skating", while short-track speed skating is known as "short track". The ISU, the governing body of both ice sports, refers to long track as "speed skating" and short track as "short track skating". ...
The sport originates from pack-style events held in North America and was officially sanctioned in the 1970s, becoming an Olympic sport in 1992. Although this form of speed skating is newer, it is growing faster than long-track speed skating, largely because short track can be done on an ice hockey rink rather than a long-track oval." [Speed skating. Wikipedia]
The vector icon example "Speed skating" represents one of 20 symbols from the Winter sports pictograms library for the ConceptDraw PRO diagramming and vector drawing software.
The design elements library Winter sports pictograms is included in the Winter Sports solution from the Sport area of ConceptDraw Solution Park.
Speed skating
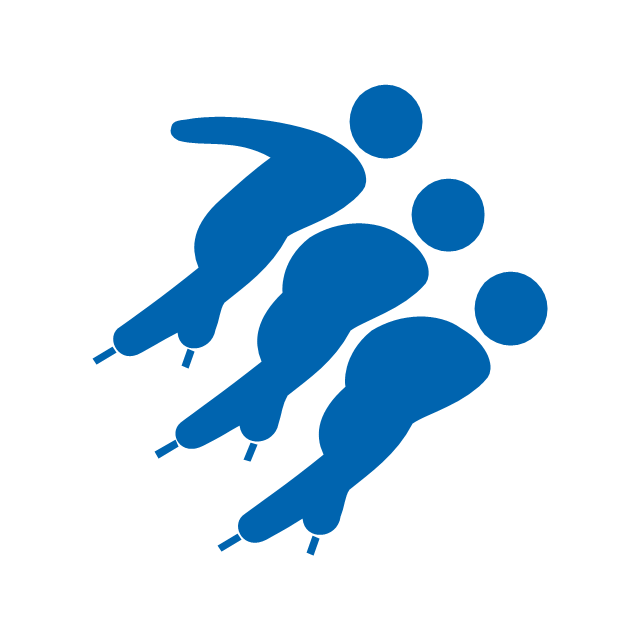
"A 'Luge' ... is a small one- or two-person sled on which one sleds supine (face up) and feet-first. Steering is done by flexing the sled's runners with the calf of each leg or exerting opposite shoulder pressure to the seat. ... Luge is also the name of an Olympic sport. Of the three Olympic sliding sports, which include bobsleigh and skeleton, luge is the fastest and most dangerous. Lugers can reach speeds of 140 km per hour (87 mph). ...
Street luge is a recent innovation of the sport. It is considered an extreme sport, as well as an Olympic sport.
Lugers compete against a timer and are timed to a thousandth of a second, making luge one of the most precisely timed sports in the world." [Luge. Wikipedia]
The vector icon example "Luge" represents one of 20 symbols from the Winter sports pictograms library for the ConceptDraw PRO diagramming and vector drawing software.
The design elements library Winter sports pictograms is included in the Winter Sports solution from the Sport area of ConceptDraw Solution Park.
Luge

 Winter Sports
The Winter Sports solution from Sport area of ConceptDraw Solution Park contains winter sports illustration examples, templates and vector clipart libraries.
Winter Sports. Using Winter Sports Design Elements Producing Infographics

Design Pictorial Infographics. Design Infographics

The vector stencils library "Winter sports pictograms" contains 20 pictograms of winter sports.
Use it to draw sport illustrations and infographics in the ConceptDraw PRO diagramming and vector drawing software extended with the Winter Sports solution from the Sport area of ConceptDraw Solution Park.
Use it to draw sport illustrations and infographics in the ConceptDraw PRO diagramming and vector drawing software extended with the Winter Sports solution from the Sport area of ConceptDraw Solution Park.
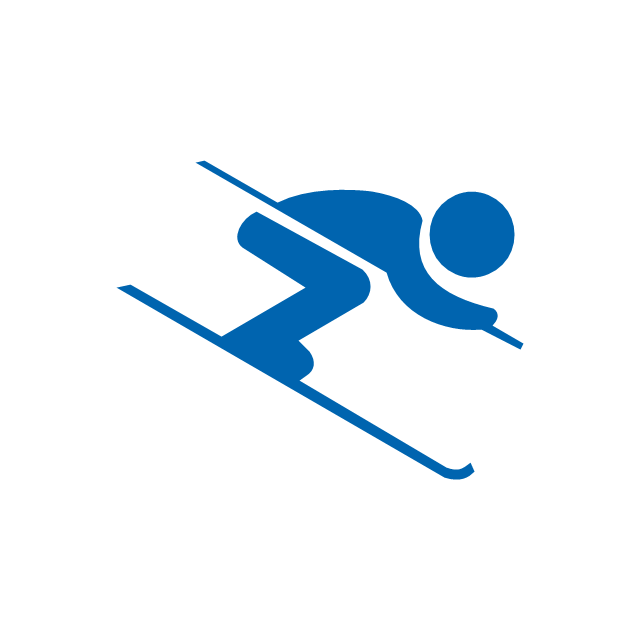
Alpine skiing
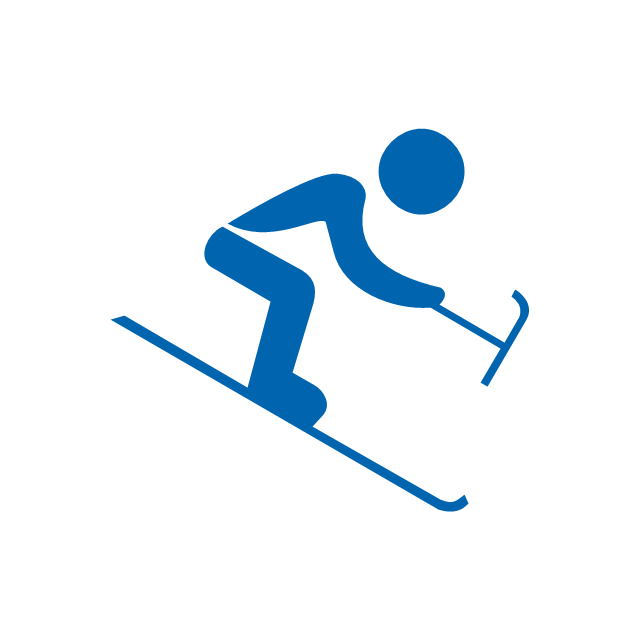
Alpine skiing, paralympic
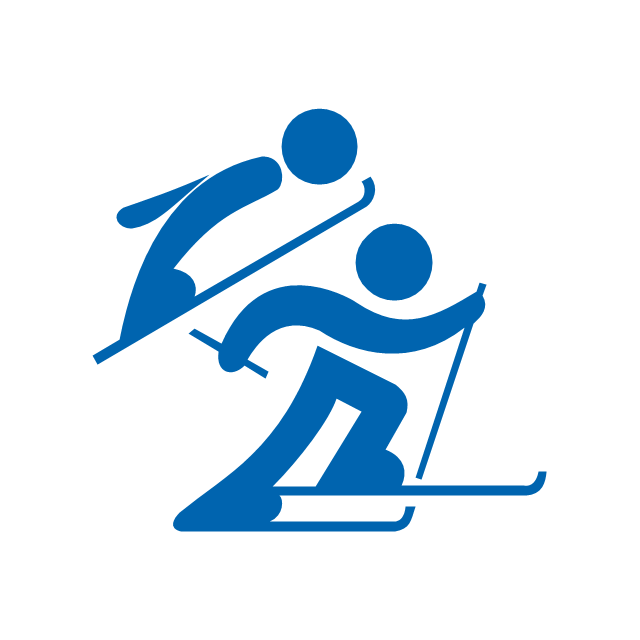
Biathlon

Biathlon, paralympic

Bobsleigh

Cross-country

Cross-country skiing, paralympic

Curling

Wheelchair curling

Figure skating

Freestyle skiing

Ice hockey
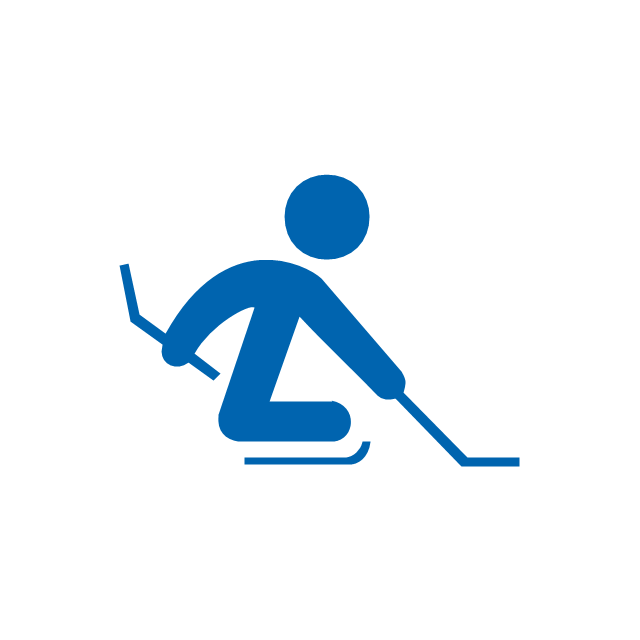
Ice sledge hockey
Luge

Nordic combined
Short track
Skeleton

Ski jumping

Snowboard
Speed skating

Mind Map Making Software

 Area Charts
Area Charts are used to display the cumulative totals over time using numbers or percentages; or to show trends over time among related attributes. The Area Chart is effective when comparing two or more quantities. Each series of data is typically represented with a different color, the use of color transparency in an object’s transparency shows overlapped areas and smaller areas hidden behind larger areas.
Flowchart

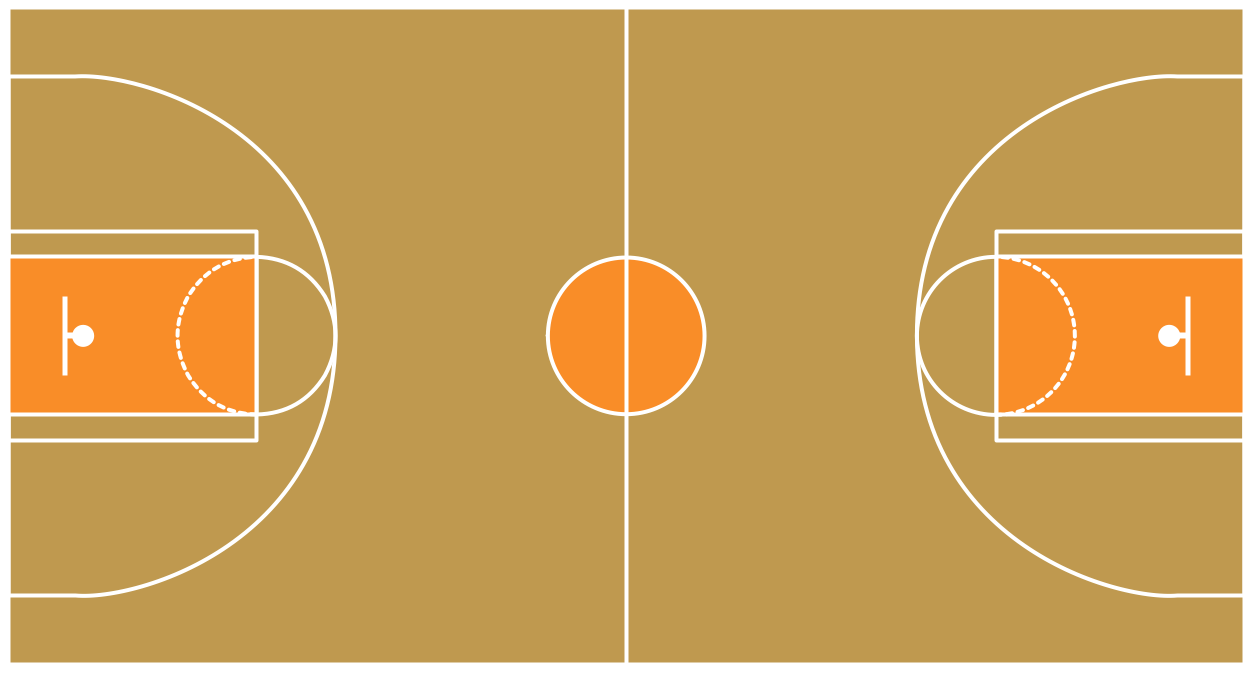
Basketball Field in the Vector
 25 Typical Orgcharts
The 25 Typical Orgcharts solution contains powerful organizational structure and organizational management drawing tools, a variety of professionally designed organization chart and matrix organization structure samples, 25 templates based on various orga
- Sport pictograms . Olympic Games | Design elements - Winter ...
- Freestyle skiing - Winter sports pictograms | Snowboarding Winter ...
- Winter Olympics pictograms - Vector stencils library | Design ...
- Winter Olympics pictograms - Vector stencils library | Winter Sports ...
- Sport pictograms . Olympic Games | Winter Sports. Using Winter ...
- Winter Olympics pictograms - Vector stencils library | Winter ...
- Winter Olympics - Figure skating | Sport pictograms . Olympic Games ...
- Winter Sports | Winter Sports. Olympic Games Illustrations. Medal ...
- Snowboard - Winter sports pictograms | Design elements - Winter ...
- Skeleton - Winter sports pictograms | Winter Olympics - Skeleton ...
- Wheelchair curling - Winter sports pictograms | Winter Olympics ...
- Luge - Winter sports pictograms | Winter Olympics - Luge | Winter ...
- Winter Olympics - Bobsleigh | Design elements - Winter sports ...
- Figure skating - Winter sports pictograms | Ice hockey - Winter sports ...
- Figure skating - Winter sports pictograms | Olympic Figure Skating Icon
- Skeleton - Winter sports pictograms | Design elements - Winter ...
- Winter Olympics - Vector stencils library | Winter Sports | Winter ...
- Snowboard - Winter sports pictograms | Speed skating - Winter ...
- Sport pictograms . Olympic Games | Winter Olympics pictograms ...