Sample Project Flowchart.
Flowchart Examples
This sample was created in ConceptDraw DIAGRAM diagramming and vector drawing software using the Flowcharts solution from the "Diagrams" area of ConceptDraw Solution Park.

Example 1. Sample Project Flowchart. The architecture of Exception Translation
This example was redesigned from the Wikimedia Commons file: JSET_Overview.jpg. [commons.wikimedia.org]
This sample shows the Flowchart that displays the architecture of SQL Exception Translation.
“There are mechanisms in which you can translate a SQL exception to the corresponding business exceptions. This is known as SQL Exception Translation. jSET - The SQL Exception Translator is one such tool. Currently this tool is Java-based.” [from Wikipedia]
You can see on this Flowchart the geometric figures that represent the steps of the process and are connected with arrows that show the sequence of the actions. The Flowcharts diagrams are widely used for designing, documenting, analyzing and managing the complex processes and programs in various fields such as science, business, engineering, architecture, manufacturing, administration, etc.
Using the ready-to-use predesigned objects, samples and templates from the Flowcharts Solution for ConceptDraw DIAGRAM you can create your own professional looking Flowchart Diagrams quick and easy.
The Flowcharts produced with ConceptDraw DIAGRAM are vector graphic documents and are available for reviewing, modifying, and converting to a variety of formats (image, HTML, PDF file, MS PowerPoint Presentation, Adobe Flash or MS Visio).
See also Samples:
TEN RELATED HOW TO's:
Garrett IA diagrams are used at development of Internet-resources, in particulars at projecting of interactions of web-resource elements. The diagram of information architecture of the web resource which is constructed correctly with necessary details presents to developers the resource in comprehensible and visual way.
Picture: Garrett IA Diagrams with ConceptDraw DIAGRAM
Infrastructure is very important part of any district, and educational buildings presence is one of the factors. Another not less important thing is the school design, because it influences the children's’ sense of aesthetics. To develop a harmonic school layout, use a proper software.
This image represents the School layout library that is supplied with ConceptDraw School and Training Plans solution. The library contains a set of vector graphic objects that will be in help while drawing a layout of classroom. Any lecturer desires to organize the layout of the classroom for the best student advantage. Students must be focused and be engaged in the learning process. The classroom places organization is an important element of a students learning. It is significant for a lecturer to set up a classroom layout and change it time to time to support lectures, to invoke disputes or solve any organizational issues. By using ConceptDraw DIAGRAM you can easily plan how to re-arrange the desks in the class room to maintain visual control of your class and build a friendly environment in the classroom.
Picture: Building Drawing Software for Design School Layout
Related Solution:
It’s very easy, quick and convenient to draw the Event-driven Process Chain (EPC) diagrams in ConceptDraw DIAGRAM diagramming and vector drawing software using the Event-driven Process Chain Diagrams Solution from the Business Processes area of ConceptDraw Solution Park.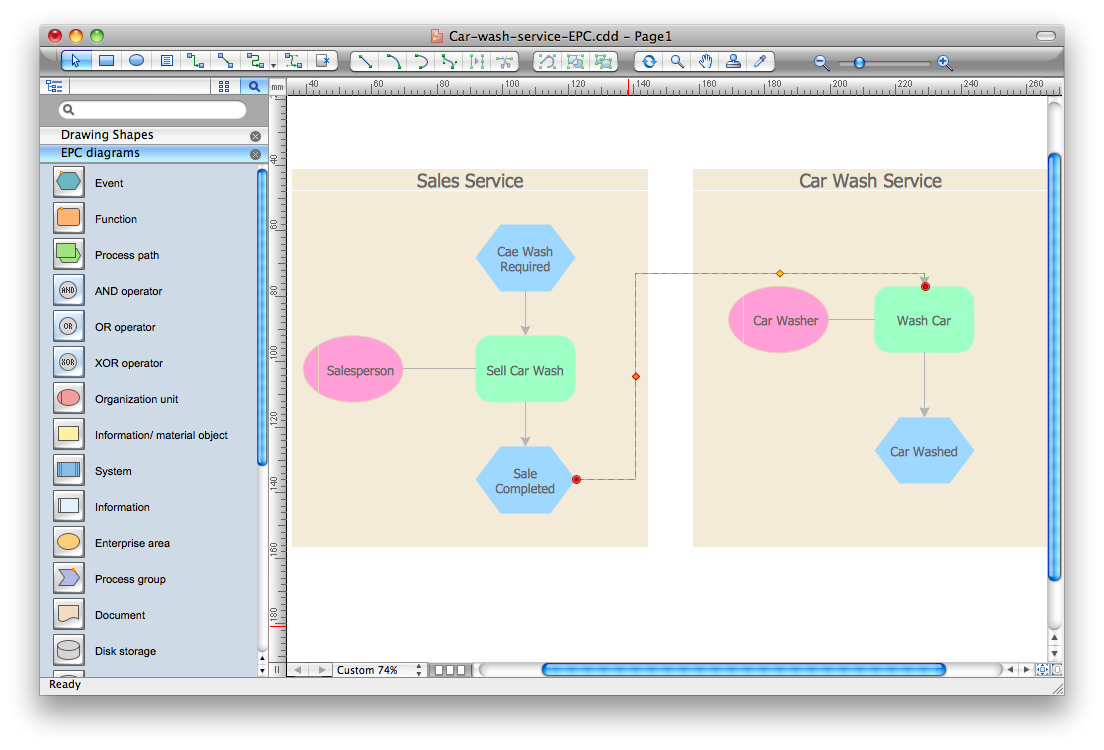
Picture: Event-Driven Process Chain Diagram Software
Related Solution:
It is convenient to use a powerful ConceptDraw DIAGRAM software extended with Flowcharts Solution to design flowcharts of various types which will additionally illustrate a definition flowchart.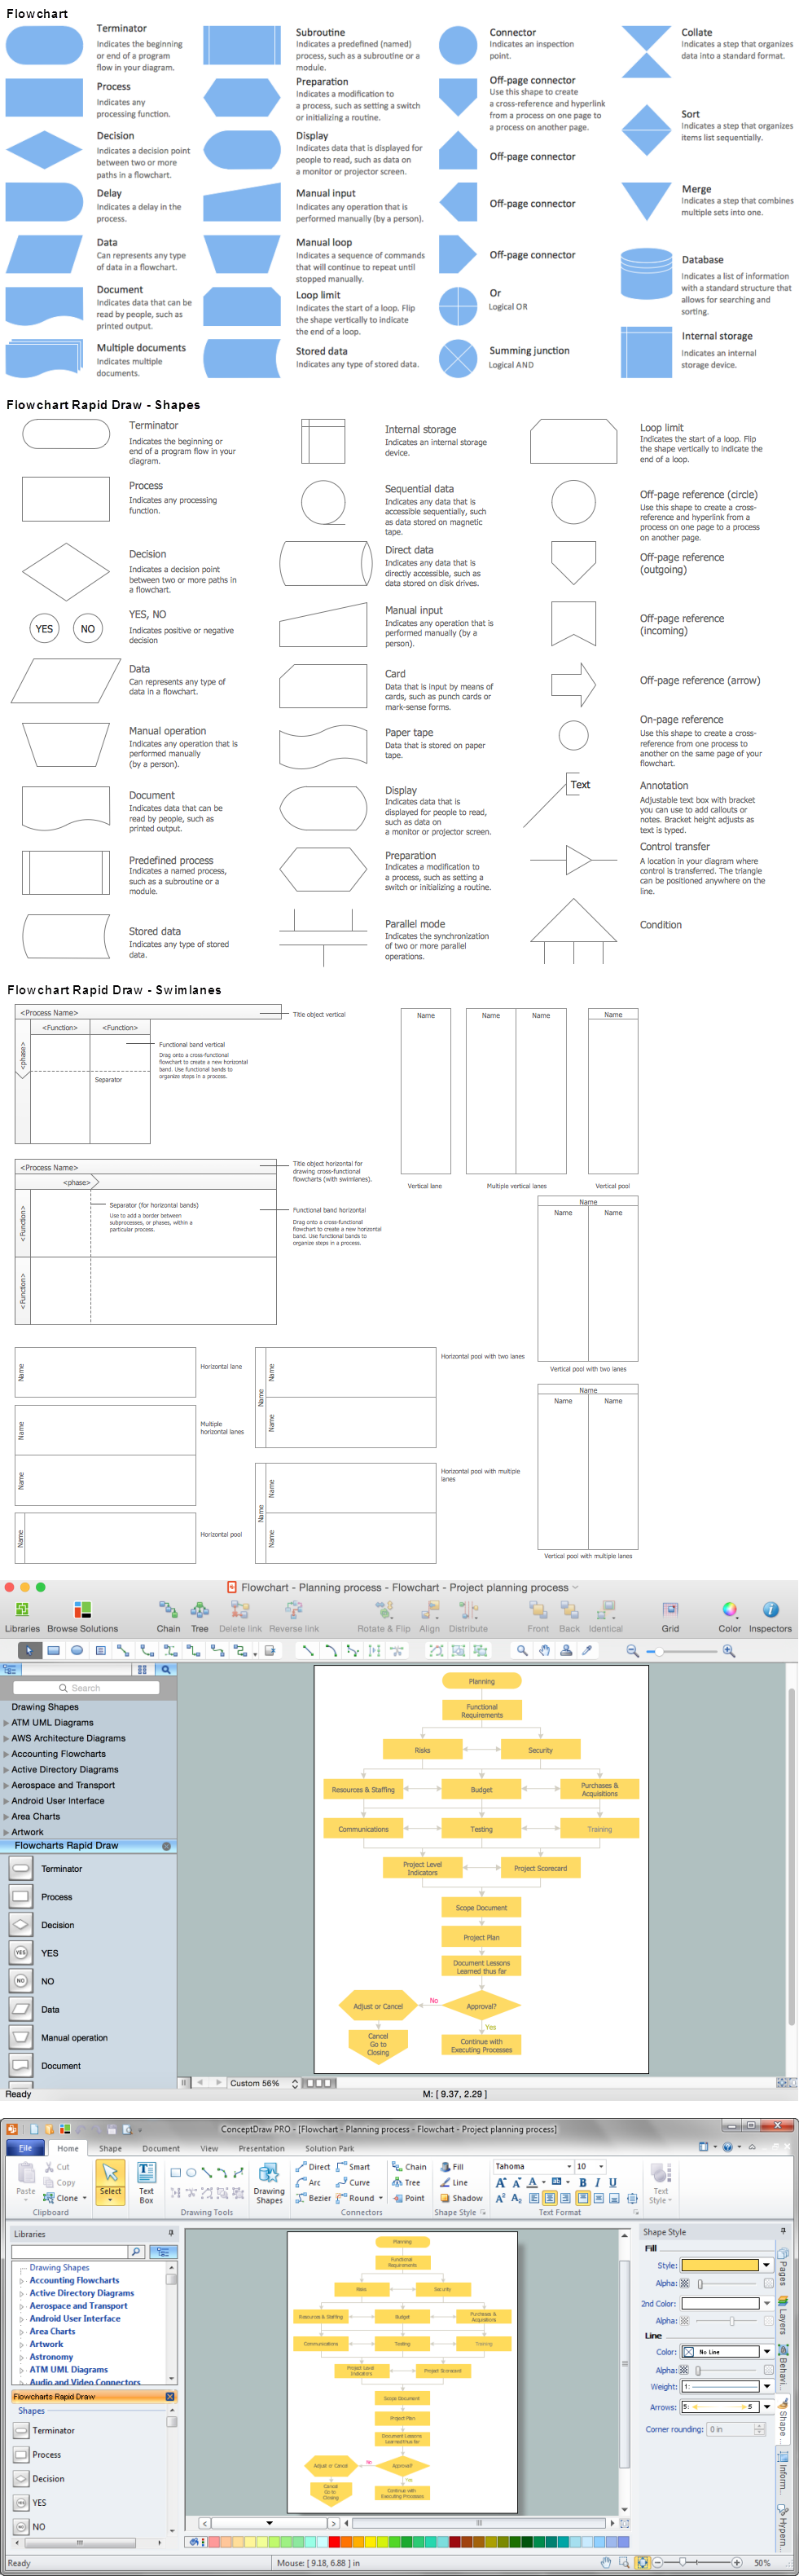
Picture: Definition Flowchart
Related Solution:
ConceptDraw DIAGRAM software extended with Fishbone Diagrams solution from the Management area of ConceptDraw Solution Park is perfect for Cause and Effect Diagram creating. It gives the ability to draw fishbone diagram that identifies many possible causes for an effect or a problem. Causes and Effects are usually grouped into major categories to identify these sources of variation. Causes and Effects in the diagram show relationships among various factor. Fishbone diagram shows factors of Equipment, Process, People, Materials, Environment and Management, all affecting the overall problem.
Picture: Cause and Effect Diagram
Related Solution:
To describe the accounting processing use ConceptDraw Flowchart set of symbold created for Accounting data processing.
Tips, Methods and Symbols on How to Create Flowcharts for an Accounting Information System.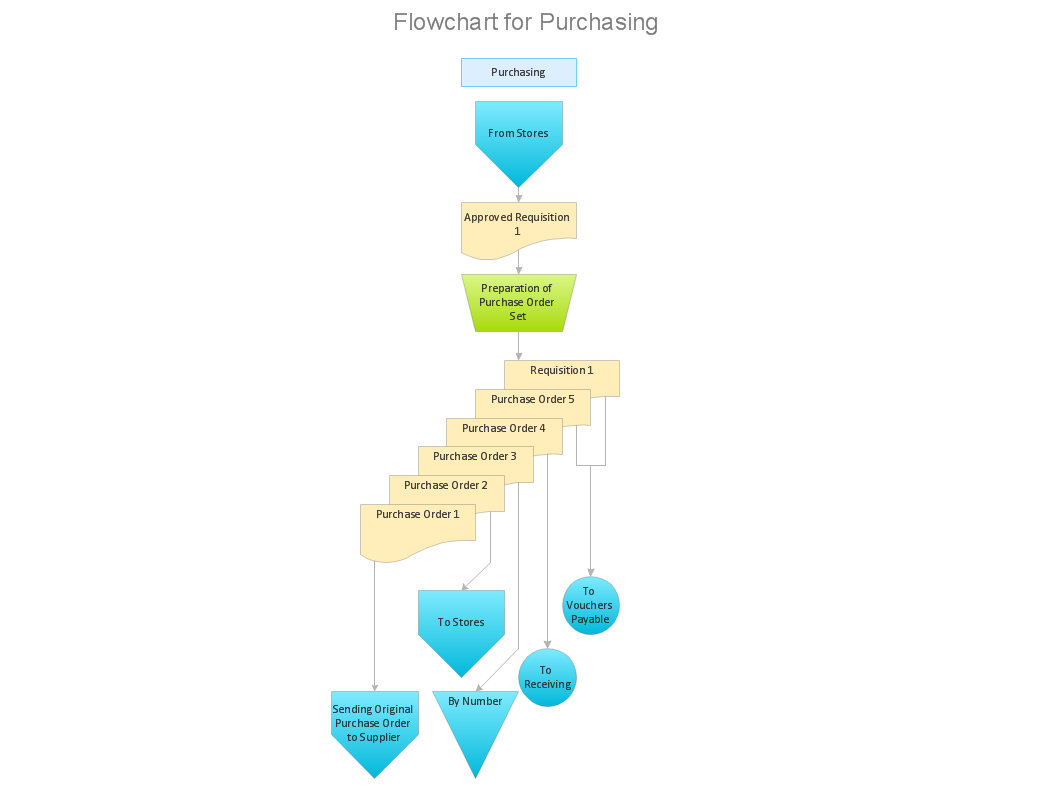
Picture: How Do You Make An Accounting Process Flowchart?
Related Solution:
Do you like infographics and data visualization? Creating infographics is super-easy with ConceptDraw.
Picture: Spatial infographics Design Elements: Transport Map
Once you have created your document in ConceptDraw DIAGRAM and you want to share it with your colleagues and friends, who uses MS Visio on their computers, you can easily export your document using ConceptDraw DIAGRAM export to Visio XML files (VDX) feature.
Now you can share your ConceptDraw documents with MS Visio users.
Picture: Export from ConceptDraw DIAGRAM Document to MS Visio® XML
UML Deployment Diagram depicts the physical deployment of artifacts on nodes (nodes are the existing hardware components, artifacts are the software components running on each node); and how the different pieces are connected.
Use ConceptDraw DIAGRAM with UML deployment diagram templates, samples and stencil library from Rapid UML solution to model the physical deployment of artifacts on nodes of your software system.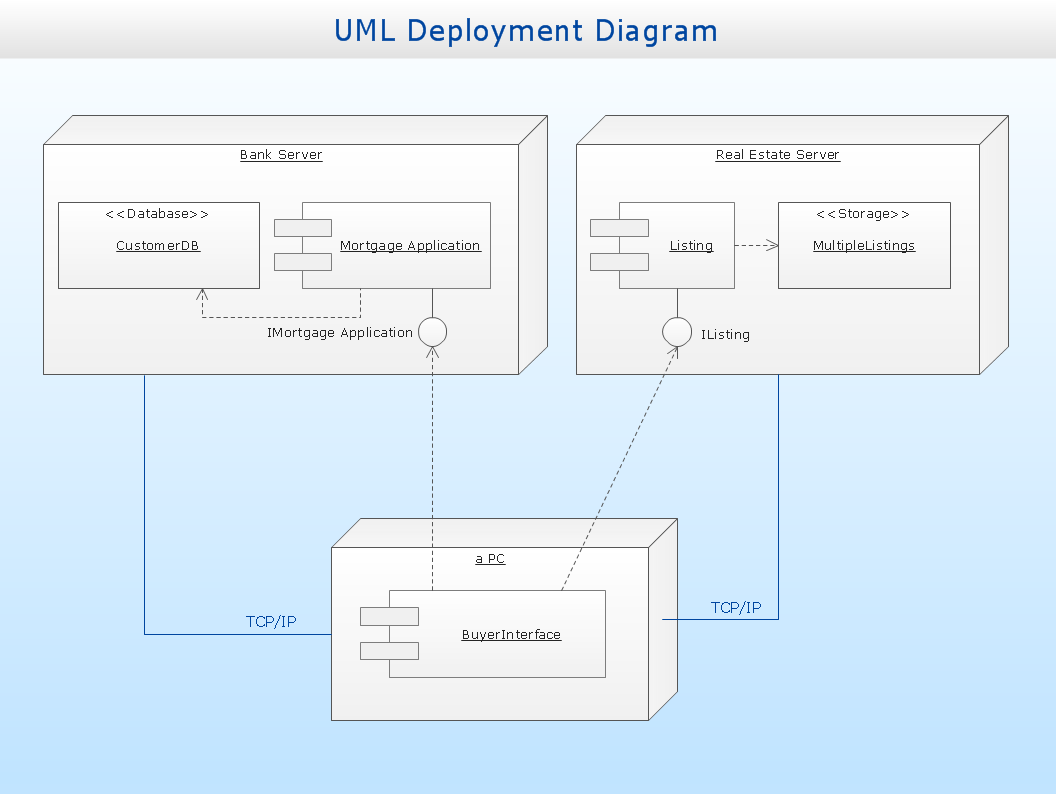
Picture: UML Deployment Diagram
Related Solution:
This sample shows the Radar Chart that compares the internet dimensions in the four countries. The Radar Chart represents the multivariate data as a two-dimensional chart with three or more variables displayed on the axes that start in one point. The Radar Charts are used in the quality management, business, analytics and sport.
Picture: Radar Chart