Physics Symbols
ConceptDraw DIAGRAM diagramming and vector drawing software extended with Physics solution from the Science and Education area is a powerful software for creating various physics diagrams.
Physics solution provides all tools that you can need for physics diagrams designing. It includes 3 libraries with predesigned vector physics symbols:
- Optics Library
- Mechanics Library
- Nuclear Physics Library
Optics Library contains 17 vector shapes of optics figures and clipart.

Sample 1. Physics Symbols — Optics Library Design Elements
Mechanics Library contains 29 vector shapes of mechanics objects.

Sample 2. Physics Symbols — Mechanics Library Design Elements
Nuclear Physics Library contains 39 vector shapes of nuclear physics symbols.

Sample 3. Physics Symbols — Nuclear Physics Library Design Elements
Simply drag the physics symbols, optics or mechanics objects and symbols from the Physics solution libraries to your document, arrange objects, type the text, add colors, and make other needed changes to design your own professional looking physics diagram in minutes. Use it successfully in your education, scientific, and any other activity.

Sample 4. Physics Solution — Proton Chain Reaction
This sample was created in ConceptDraw DIAGRAM using the physics symbols from the Physics Solution and visually demonstrates Proton Chain Reaction. An experienced user spent 5 minutes creating this sample.
The physics diagrams designed with ConceptDraw DIAGRAM are vector graphic documents and are available for reviewing, modifying, converting to a variety of formats (image, HTML, PDF file, MS PowerPoint Presentation, Adobe Flash or MS Visio), printing and send via e-mail in one moment.
TEN RELATED HOW TO's:
SWOT analysis is an effective method of business planning, the question is how to do it. The most obvious way is to make a SWOT analysis in a Word document, which is not very convenient. Luckily, you can use software like ConceptDraw DIAGRAM that has features and templates made especially for SWOT analyzing.
A SWOT Analysis is a manager's means of the strategic planning. It is used to define and classify considerable internal moments (strengths and weaknesses) and external forces (opportunities and threats) a business faces. You can use ConceptDraw MINDMAP to determine and organize factors utilized for SWOT analysis, and represent them in the SWOT matrix using ConceptDraw DIAGRAM. Using mind maps empowers you to explore and rank a lot of data engaged for SWOT analysis as well as recognize the relations between various pieces of information.
Picture: How to Make SWOT Analysis in a Word Document
Related Solution:
ConceptDraw DIAGRAM creates drawings, diagrams and charts with great visual appeal in Mac OS X.
Picture: Best Vector Drawing Application for Mac OS X
Related Solution:
The Venn diagram example below shows sustainable development at the confluence of three constituent parts.
Create your Venn diagrams for problem solving in environmental social science using the ConceptDraw DIAGRAM diagramming and vector drawing software extended with the Business Diagrams solution from the Management area of ConceptDraw Solution Park.
Picture: Venn Diagram Examples for Problem Solving. Environmental Social Science. Human Sustainability Confluence
Related Solution:
The Total Quality Management Diagram solution helps you and your organization visualize business and industrial processes. Create Total Quality Management diagrams for business process with ConceptDraw software.
Picture: TQM Diagram Tool
Related Solution:
The ConceptDraw DIAGRAM is a professional software for quick creating great looking flowcharts. The vector stencils from object libraries allows you to use RapidDraw technology. By the clicking on direction arrows one can add new object to flowcharts. This technology gives to users the ability to fast creating visualization for the structural data.
Learn the basics of flowcharting and see how to build create a flowchart using ConceptDraw automatic drawing tools.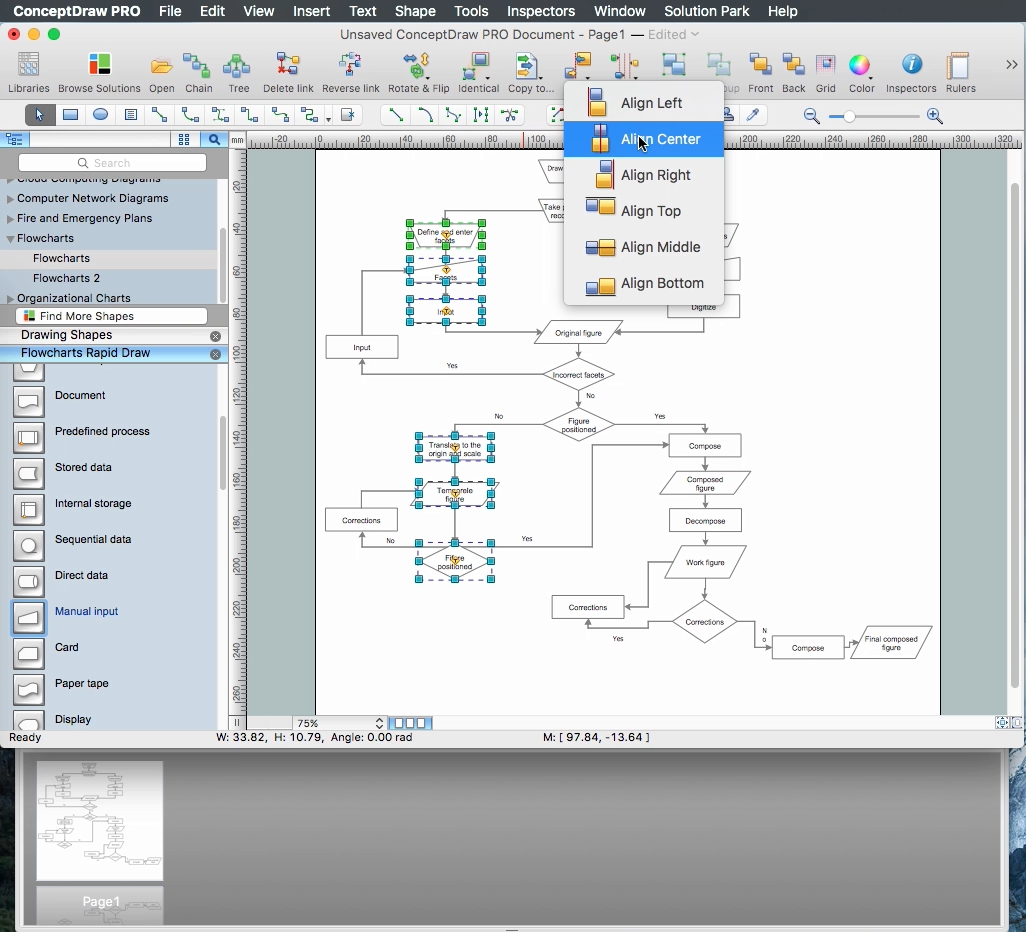
Picture: How to Build a Flowchart
Related Solution:
The Total Quality Management Diagram solution helps you and your organization visualize business and industrial processes. Create Total Quality Management diagrams for business process with ConceptDraw software.
Picture: TQM Software — Build Professional TQM Diagrams
Related Solution:
Charting Software allows you to create diagrams, charts, graphs, flowcharts, and other business graphics. ConceptDraw DIAGRAM include simple shape drawing tools, examples, templates, and symbol libraries.
Picture: Create Graphs and Charts
Related Solution:
No building project can exist without an electrical circuit map. It’s more convenient to develop electrical drawing with a proper software which would contain vector shapes and electrical symbols. This will help in the future if any problems appear.
This circuit diagram shows the scheme of a location of components and connections of the electrical circuit using a set of standard symbols. It can be use for graphical documentation of an electrical circuit components. There are many of different electric circuit symbols that can be used in a circuit diagram. Knowing how to read circuit diagrams is a useful skill not only for professionals, but for any person who can start creating his own small home electronic projects.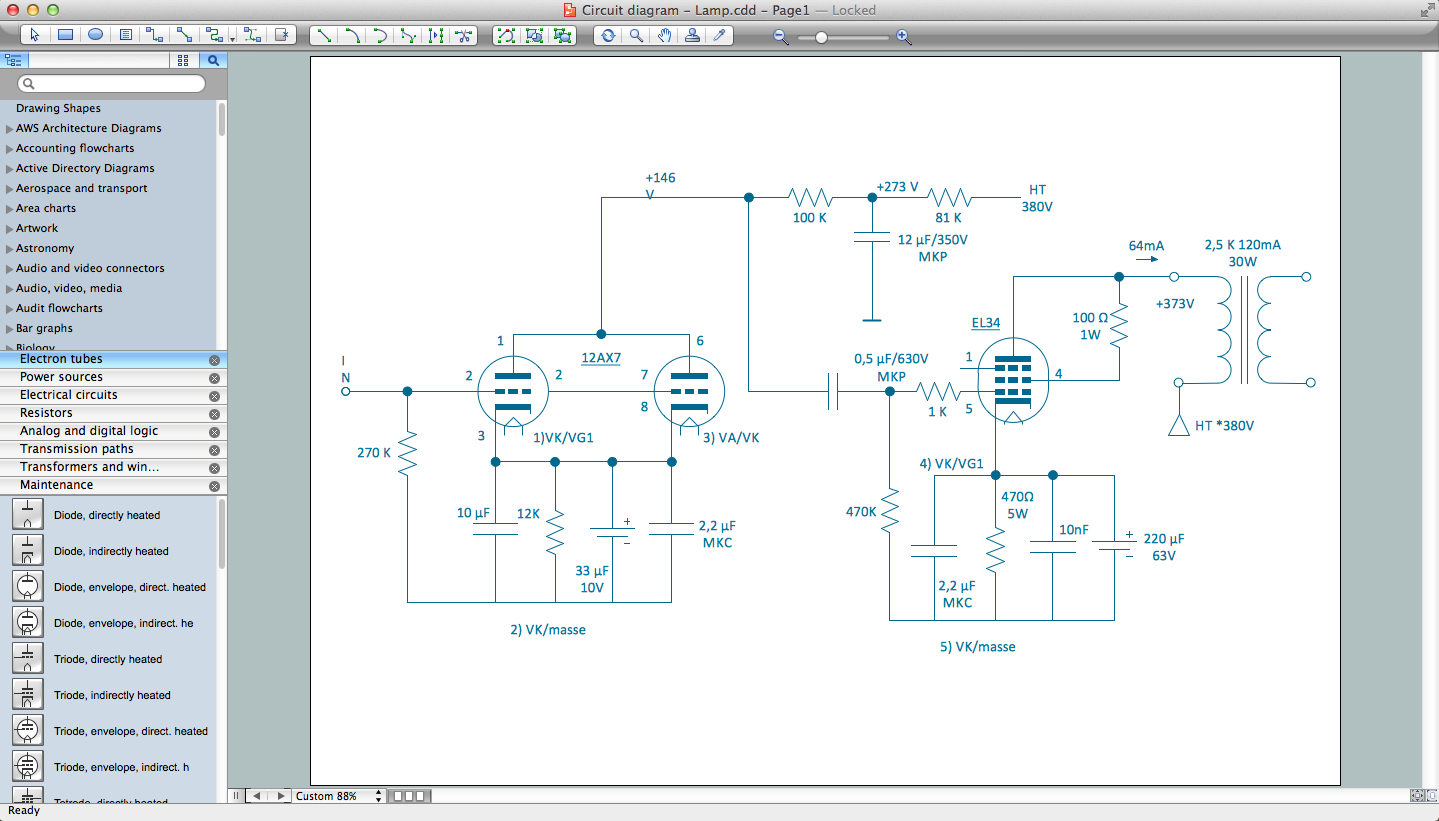
Picture: Electrical Drawing Software and Electrical Symbols
Related Solution:


