Made with
ConceptDraw
MINDMAP 16

Computer Hardware - Reseller Business Plan

ConceptDraw Office

ConceptDraw Office is an integrated set of visualization products and document exchange technologies. ConceptDraw OFFICE consists of a diagramming platform, a mind mapping, and a project management tool. These tools are essential to generate business diagrams, mind maps, project plans, dashboards, presentations, schematics, and any other business visualizations. These tools have access to an online service, ConceptDraw Solution Park that will deliver additional product extensions in the future. This is a time saving assistant for generating your business documents and presentations.

ConceptDraw Office consists of a diagramming platform, a mind mapping, and a project management tool. These tools are essential to generate business diagrams, mind maps, project plans, dashboards, presentations, schematics, and any other business visualizations.

ConceptDraw MINDMAP Samples

Sample mind maps created in ConceptDraw MINDMAP that demonstrate the different capabilities and applications of the program for business, personal, or education use.

A more detailed mind map of a business plan for a computer hardware reseller.

Computer Hardware - Reseller Business Plan *

Example 1. Computer Hardware - Reseller Business Plan


Export to Outline


Computer Hardware - Reseller Business Plan
  • Executive Summary
    • Highlights
    • Objectives
    • Mission
    • Keys to Success
  • Company Summary
    • Company Ownership
    • Company History
      • Past Performance (Tables)
      • Past Performance (Highlights)
    • Company Locations and Facilities
  • Products and Services
    • Product and Service Description
    • Competitive Comparison
    • Sales Literature
    • Fulfillment
    • Technology
    • Service and Support
    • Future Products and Services
  • Market Analysis Summary
    • Market Segmentation
      • Market Analysis (Pie)
      • Market Analysis (Table)
    • Target Market Segment Strategy
      • Market Needs
      • Market Trends
      • Market Growth
    • Service Business Analysis
      • Business Participants
      • Distributing a Service
      • Competition and Buying Patterns
      • Main Competitors
  • Strategy and Implementation Summary
    • Strategy Pyramids
    • Value Proposition
    • Competitive Edge
    • Marketing Strategy
      • Positioning Statements
      • Pricing Strategy
      • Promotion Strategy
    • Sales Strategy
      • Sales by Year. Sales Forecast
      • Sales Monthly. Sales Forecast
      • Sales Programs
      • Distribution Strategy
    • Strategic Alliances
      • Milestones (Table)
      • Milestones (Gantt chart)
  • Management Summary
    • Organizational Structure
    • Management Team
    • Management Team Gaps
    • Personnel Plan
    • Other Management Considerations
  • Financial Plan
    • Important Assumptions
      • General Assumptions
    • Key Financial Indicators
      • Benchmarks
    • Break-even Analysis
      • Graphic
      • Table
    • Projected Cash Flow
      • Profit and Loss (Table)
    • Projected Profit and Loss
      • Cash
      • Cash Flow (Table)
    • Projected Balance Sheet
      • Balance Sheet (Table)
    • Business Ratios
      • Ratio Analysis

The Benefits for ConceptDraw MINDMAP Brainstorming Software

  • ConceptDraw MINDMAP is effective for brainstorming, designing mind maps, idea generating, creative and lateral thinking, creativity and problem solving.
  • ConceptDraw MINDMAP is ideal for team and personal work in Business, Marketing and Project Management.
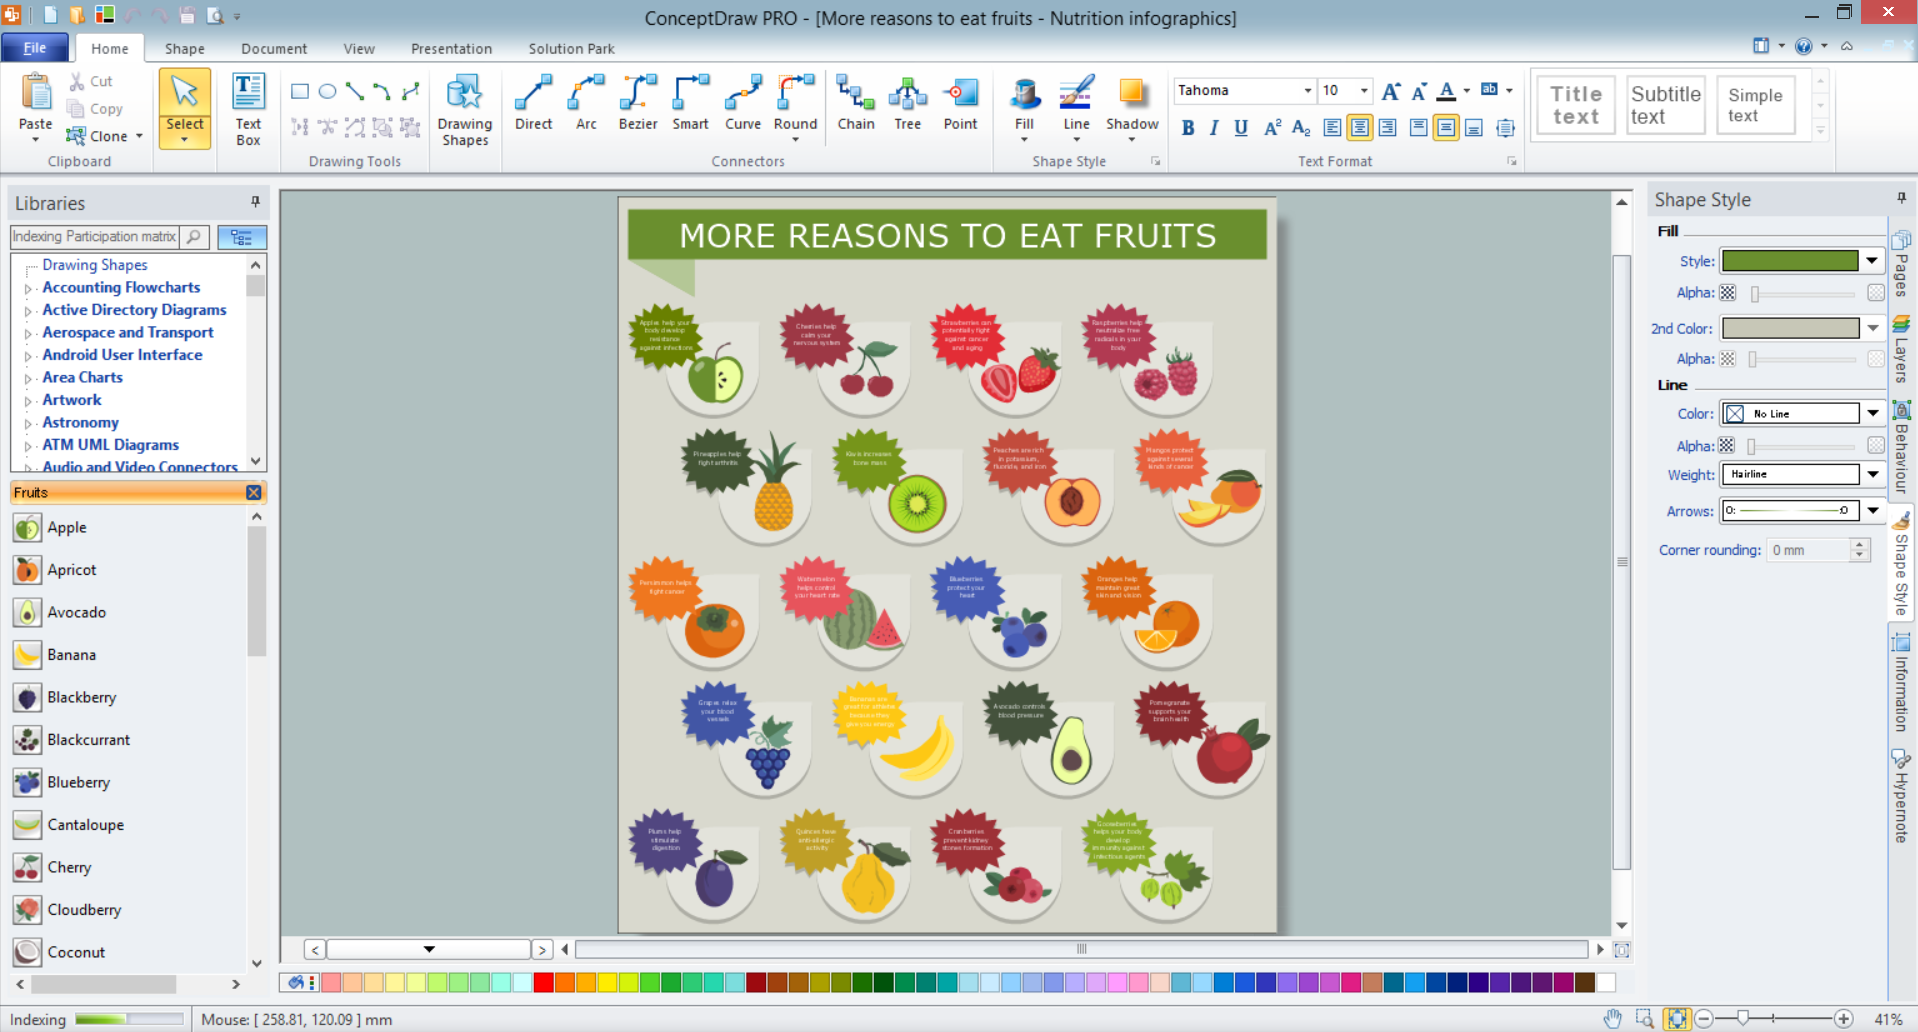
  • The libraries with large quantity of vector objects help to illustrate your mind maps and to make them bright, visual and comprehensible.
  • Use of View Navigator tool lets create presentations from a mind map: you can simply select the map parts you want to present, sequence your slides, and preview the presentation.
  • ConceptDraw MINDMAP provides wide capabilities of importing and exporting in various formats: Microsoft PowerPoint, Microsoft Word, MS Excel, Mindjet MindManager, image, HTML, PDF file.


TEN RELATED HOW TO's:
A flowchart is a powerful tool for examining processes. It helps improving processes a lot, as it becomes much easier to communicate between involved people, to identify potential problems and to optimize workflow. There are flowcharts of different shapes, sizes and types of flowchart vary from quite basic process flowcharts to complex program flowcharts. Nevertheless, all these diagrams use the same set of special symbols like arrows to connect blocks, parallelogram to show data receiving or rectangles for showing process steps. Basic flowcharts are used to represent a simple process algorithm. A basic flowchart notation consists of rectangles (business processes), arrows (the flow of information, documents, etc.). The same notation is used in items such as the "decision", which allow you to do the branching. To indicate the start of the entire business process and its termination can be used the "Terminator" element. The advantages of Basic Flowchart are simplicity and clarity. With it you can quickly describe the business process steps. Creating of Basic Flowchart does not require any special knowledge, as easily understand by employees with different levels of education and IQ.Types of Flowchart — Overview
Picture: Types of Flowchart: Comprehensive Overview
Related Solution:
A pie chart is a circular diagram showing a set of data divided into proportional slices. There are several variations of this chart such as donut chart, exploded pie chart, multi-level pie charts. Although it is not very informative when a ring chart or circle chart has many sections, so choosing a low number of data points is quite important for a useful pie chart. ConceptDraw DIAGRAM software with Pie Charts solution helps to create pie and donut charts for effective displaying proportions in statistics, business and mass media for composition comparison, i.e. for visualization of part percentage inside one total.Pie Chart Software
Picture: Pie Chart Software
Related Solution:
Everything about Bookkeeping: Accounting flowchart process. Which symbols to use, how to make a chart.Introduction to bookkeeping: <br>Accounting flowchart process *
Picture: Introduction to bookkeeping: Accounting flowchart process
Related Solution:
Explore practical flowchart examples including business process diagrams, workflow charts, swimlane flowcharts, and IT troubleshooting flows. Review common patterns and start from ready templates.Simple flowchart example showing an approval decision process
Picture: Flowchart Examples
Related Solution:
Fruits are unique products, they are beautiful and delicious, and look amazing in the compositions. Fruits are perfect for decorating various dishes, desserts and beverage. Each composition of fruits is a real fruit art! ConceptDraw DIAGRAM diagramming and vector drawing software extended with Food Court solution from the Food and Beverage area of ConceptDraw Solution Park perfectly suits for fruit art design and easy drawing attractive food and beverage illustrations.Fruit Art *
Picture: Fruit Art
Related Solution:
The available pre-made examples of the matrices, including the Porter's Value Chain’s one can be found in the mentioned solution. It also allows creating an Ansoff matrix, a BCG matrix, a Competitive strategies matrix, a Four-quadrant matrix, a Chore chart, a Flow process chart, a Quality function deployment matrix, a Positioning map and Porter’s generic strategies matrix being based on the templates given within the Matrices solution.Porter
Picture: Porter's Value Chain
Related Solution:
A list of parameters on which networks differ is very long. A large network with a range up to 50 kilometers is called metropolitan area network (MAN), and this type of network can include several local area networks. Metropolitan networks in their turn connect into global area networks. Here you will see a Metropolitan Area Network (MAN). This is an extensive network which occupies a large territory including a few buildings or even the whole city. The space of the MAN is bigger than LAN, but lower than WAN. MAN comprise a lot of communication equipment and delivers the Internet connection to the LANs in the city area. Computer and Networks solution for ConceptDraw DIAGRAM provides a set of libraries with ready-to-use vector objects to design various kinds of computer networks.Metropolitan area networks (MAN). Computer and Network Examples
Picture: Metropolitan area networks (MAN). Computer and Network Examples
Related Solution:
ConceptDraw DIAGRAM software exteneded with the Sales Dashboard solution is perfect for visualizing sales data. This is the best tool to analyse your sales perfornance and see how your business can improve.Sales Dashboard Screenshot *
Picture: Sales Dashboard Screenshot
Problems are obstacles and challenges that one should overcome to reach the goal. They are an inseparable part of any business, and the success of an enterprise often depends on ability to solve all problems effectively. The process of problem solving often uses rational approach, helping to find a suitable solution. Using Fishbone Diagrams for Problem Solving is a productive and illustrative tool to identify the most important factors causing the trouble. ConceptDraw DIAGRAM extended with Fishbone Diagrams solution from the Management area of ConceptDraw Solution Park is a powerful tool for problem solving with Fishbone Ishikawa diagram graphic method.Using Fishbone Diagrams for Problem Solving *
Picture: Using Fishbone Diagrams for Problem Solving
Related Solution:
House of Quality Matrix Software - Use the predesigned objects from the Involvement Matrix Objects Library from the Seven Management and Planning Tools Solution to create professional looking House of Quality Matrices in minutes.House of Quality Matrix Software *
Picture: House of Quality Matrix Software
Related Solution:
ConceptDraw
MINDMAP 16