Lean Manufacturing Diagrams
The new Value Stream Mapping solution continues to extend the range of ConceptDraw DIAGRAM into a business graphics tool that can be used to document processes of Lean Manufacturing. Value Stream Mapping solution can be used for drawing flow diagram in great detail every step of a manufacturing process. This graphical representation of a process is a powerful tool that helps in the diagnosis of process efficiency and allows companies to develop improved processes. Also users can export final document to PDF, PowerPoint, and popular graphic formats.

Pic.1 Value stream mapping (VSM) design elements.
One library with 40 vector shapes is included in the Value Stream Mapping solution.
Use it in your Lean Manufacturing practice for the drawing value stream mapping (VSM) diagrams with ConceptDraw DIAGRAM
See also Samples:
TEN RELATED HOW TO's:
The Value stream is a totality of all actions on the projection, order composition and production: starting from creation a product project to launching this product, from order to delivery, from extraction of raw materials to ready product manufacturing. Value stream mapping is a process of visualization of these actions and creation of a detailed and graphical map.
Picture: Value stream with ConceptDraw DIAGRAM
Related Solution:
Process Flow Chart is a visual diagram which shows the processes and relationships between the major components in a system, and uses for this the special process flow chart symbols: special shapes to represent different types of actions and process steps, lines and arrows to represent relationships and sequence of steps. It often named process flow diagram, it use colored flowchart symbols.
It is incredibly convenient to use the ConceptDraw DIAGRAM software extended with Flowcharts Solution from the Diagrams Area of ConceptDraw Solution Park for designing professional looking Process Flow Charts.
Picture: Process Flow Chart Symbols
Related Solution:
Stakeholders are the groups of people or organizations whose contribution matters to the organization's success, this can be labour participation, financial participation, dissemination of information about organization, etc. So, the employees of the company, its suppliers, customers, media, public organizations, state authorities, all they are stakeholders of the company.
ConceptDraw DIAGRAM diagramming and vector drawing software extended with Stakeholder Onion Diagrams Solution from the Management Area of ConceptDraw Solution Park is a powerful stakeholder mapping tool which allows easy create Stakeholder Onion diagrams and maps depicting the layers of a project, relationships of stakeholders to a project goal, and relationships between stakeholders.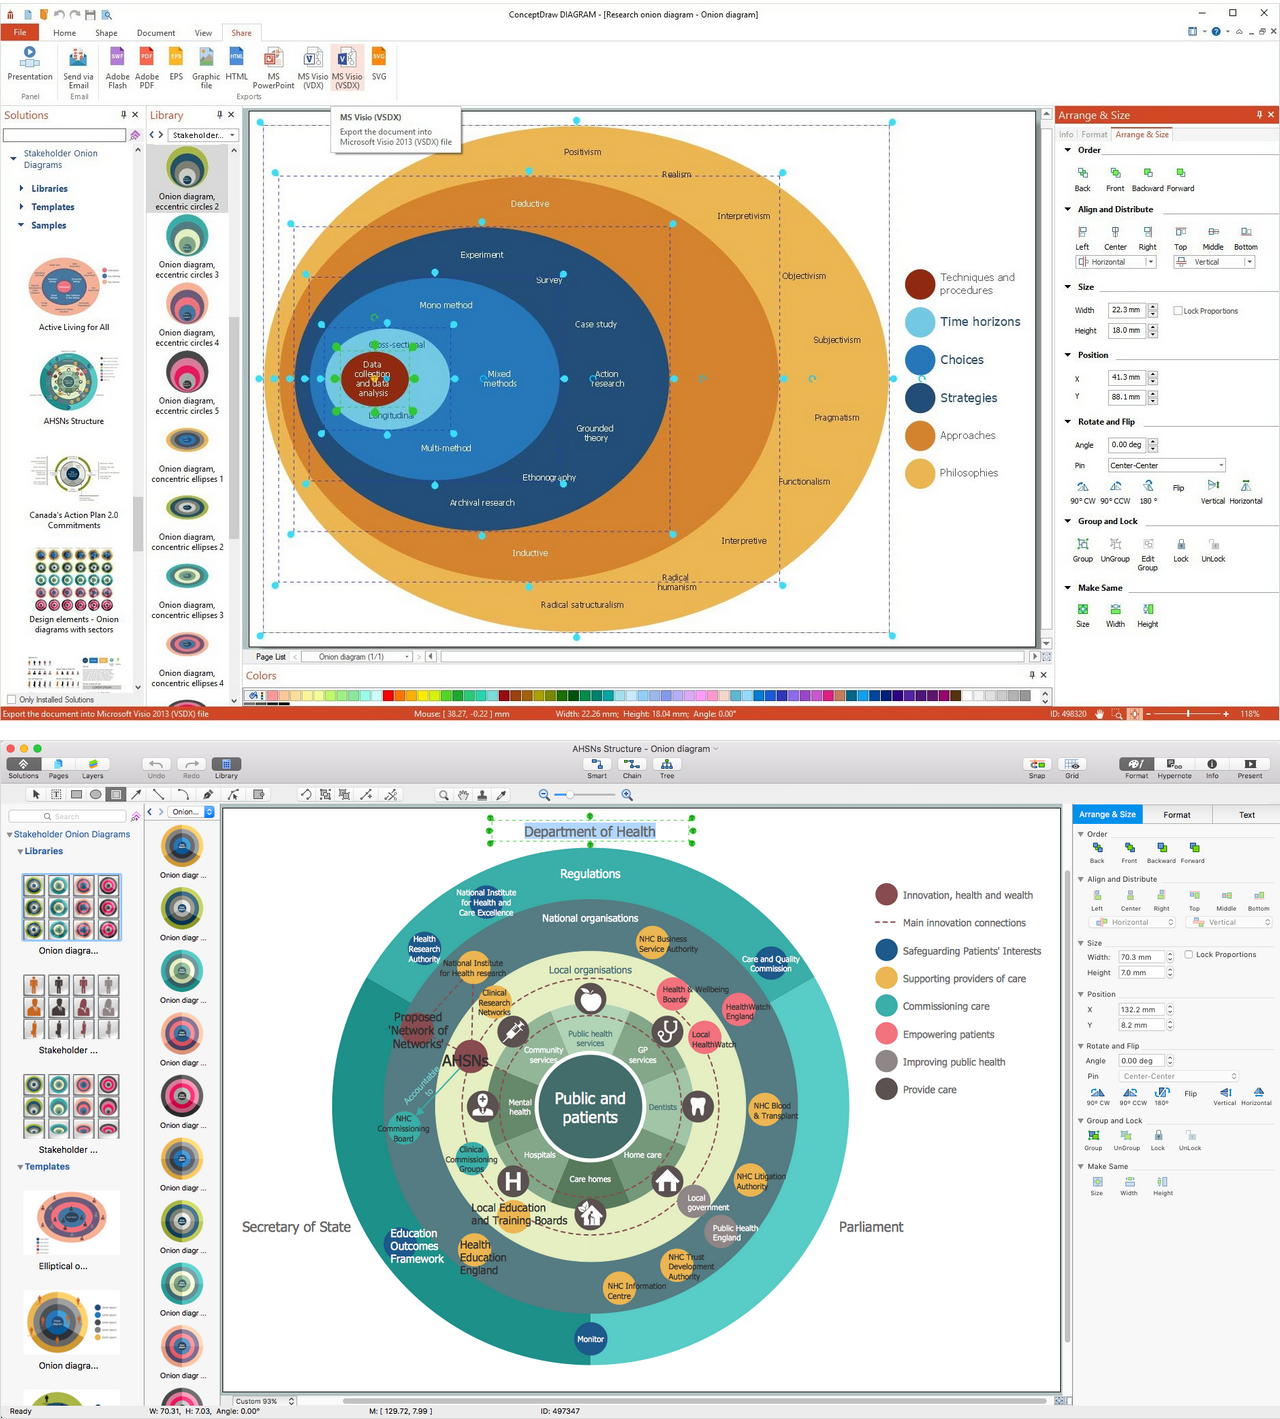
Picture: Onion Diagram as Stakeholder Mapping Tool
Related Solution:
The United Kingdom of Great Britain and Northern Ireland, commonly known as the United Kingdom (UK), is a sovereign state in Europe which consists of four countries: England, Scotland, Wales, and Northern Ireland. UK is surrounded by the waters of Atlantic ocean, the North Sea, the English Channel, and the Irish Sea and includes large number of big and small islands.
ConceptDraw DIAGRAM diagramming and vector drawing software offers the unique Map of UK Solution from the Maps Area of ConceptDraw Solution Park that is indispensable for easy drawing professional looking map of UK, UK counties map, UK map with cities, map of Scotland, map of England, map of Wales, Northern Ireland map.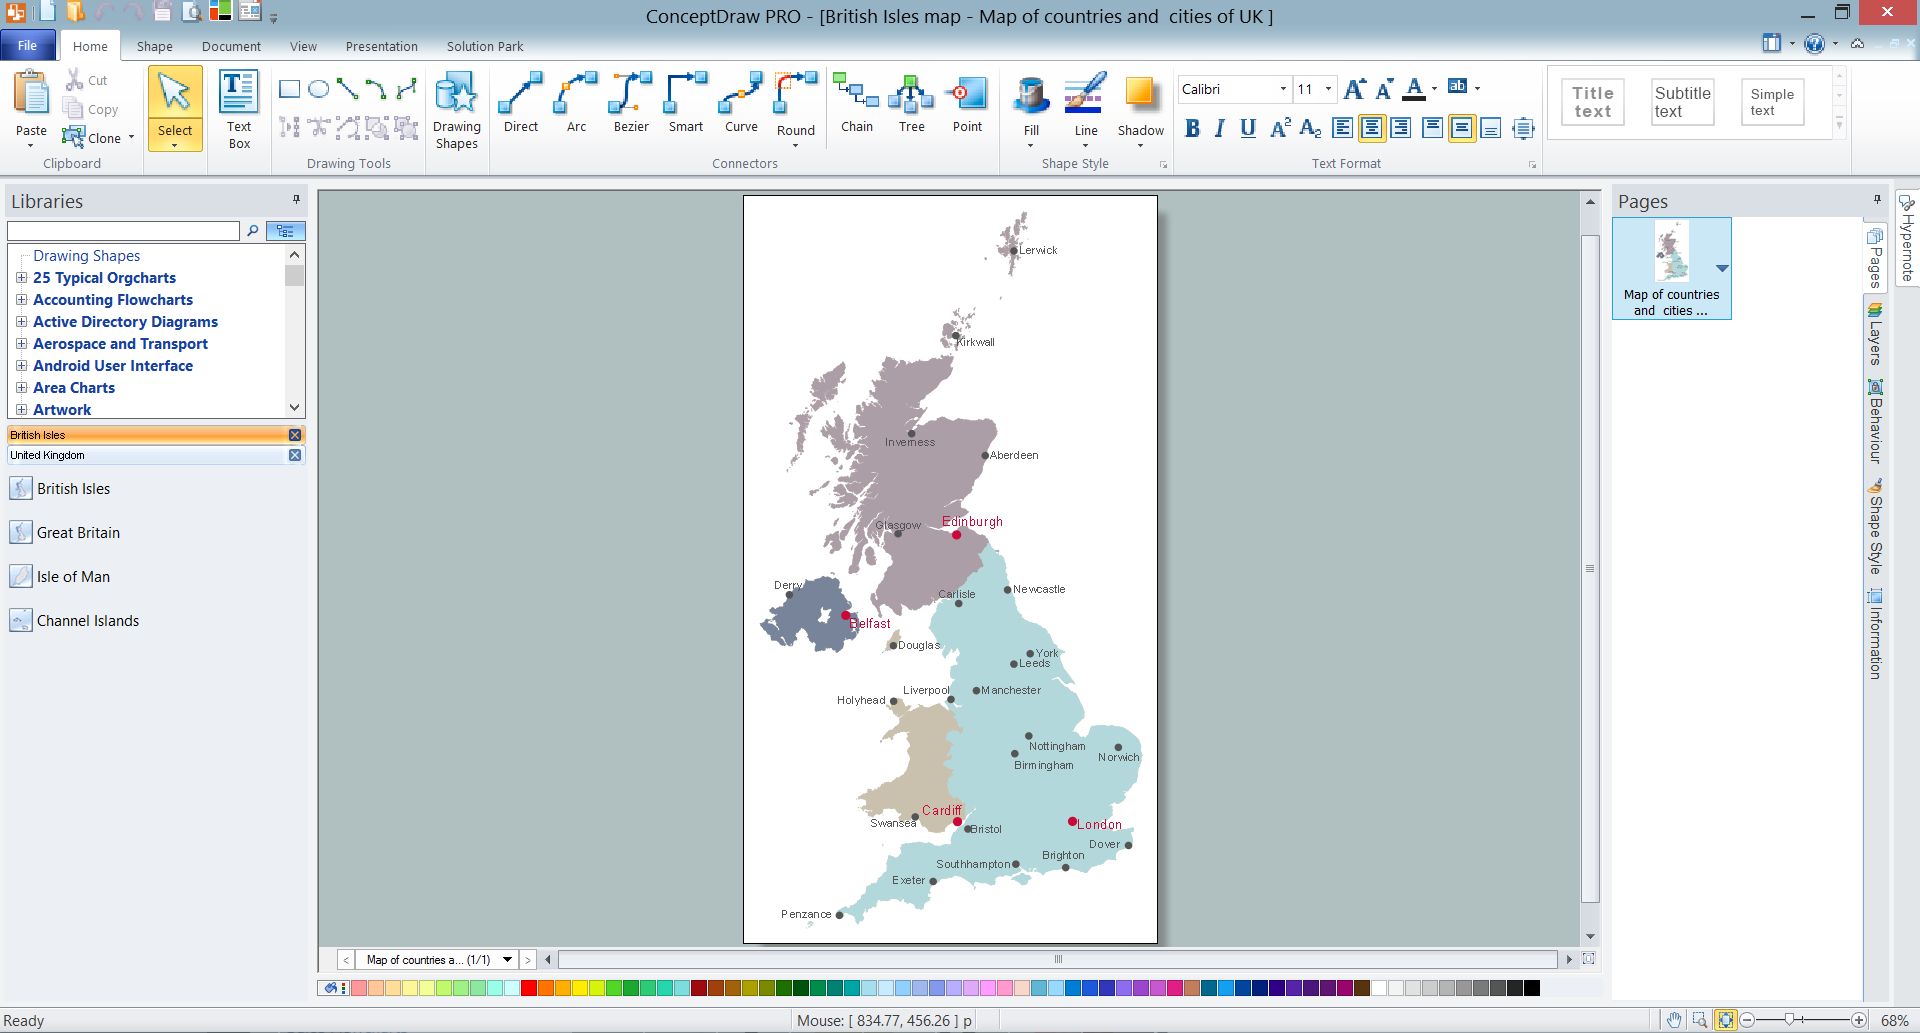
Picture: UK Map
Related Solution:
This sample was created in ConceptDraw DIAGRAM diagramming and vector drawing software using the Workflow Diagrams Solution from the Software Development area of ConceptDraw Solution Park.
This sample shows the Workflow Diagram that clearly illustrates stages a BPM consists of and relations between all parts of business. The Workflow Diagrams are used to represent the transferring of data during the work process, to study and analysis the working processes, and to optimize a workflow.

Picture: Software Work Flow Process in Project Management with Diagram
Related Solution:
Create value stream maps - for value stream analysis and value stream management, material and information flow mapping, using our quick start templates included with ConceptDraw.
Picture: Value-Stream Mapping for Manufacturing
Related Solution:
Value Stream Mapping solution extends ConceptDraw DIAGRAM software with templates, samples and vector shapes for drawing the current state value stream maps.
Picture: Learn how to create a current state value stream map
Related Solution:
Download ConceptDraw diagram software for easy drawing.
Picture: The Best Choice for Creating Diagram
Related Solution:
Chemical and Process Engineering solution contains variety predesigned process flow diagram elements relating to instrumentation, containers, piping and distribution necessary for chemical engineering, and can be used to map out chemical processes or easy creating various Chemical and Process Flow Diagrams in ConceptDraw DIAGRAM.
Picture: Process Flow Diagram Symbols
Related Solution: