IDEF1X Standard
|
IDEF1x standard is developed for work with relational data bases. In particular IDEF1x standard is meant for constructing of conceptual schemes which represent the structure of data in the context of the concerned system, for example, a commercial organization. IDEF1x standard is a static method and is not intended for dynamic analysis, but it can be used for this, as an alternative to IDEF1 standard.It is necessary to remember that IDEF1x standard is developed specially for construction of data base structure and that for work it requires an entering of definite data which is not necessary for work with other objects. For example, it requires an entering of dominant attributes to distinguish entities, which is not necessary in the object-oriented projection, so for such projection it is better to use the corresponding IDEF4 standard. In general the terminology of IDEF1x standard coincides with the terminology of IDEF1 standard, however there are some differences. In IDEF1x the entity is a totality of objects of the real world similar by key properties. Each concrete object in this case is a realization of this entity. For instance an entity COMPUTER represents the totality of all computers of an organization. Each copy of the COMPUTER entity must contain definite information such as computer ID, the name in the network, characteristics, etc. This information is called attributes of an entity.
In IDEF1x entities are connected between each other with links, ties and associations. Ties are called in the verb form. Names of ties show entities relations. For example an ORGANIZATION |
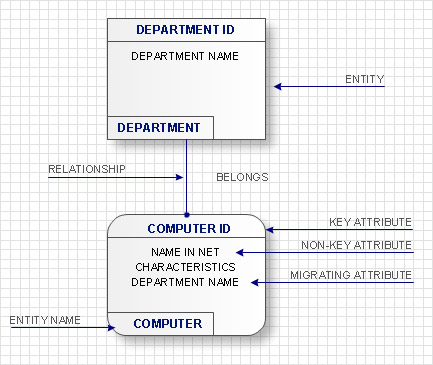
The first entity in the above mentioned examples is connected with several entities of the second type therefore such tie is called ‘one to many’. At that, the first entity is called parental, and subsequent are daughters. (Child?) On the diagram ties are represented in the form of lines with the dot at the end and with the name specification. Also there are ties of the type ‘many to many’. They are used at the starting stage of the projection and represented in the form of lines with dots at both ends. As an example of such tie is the tie between the mass of PASSNGERS which
Accordingly to IDEF1x standard entities are represented in the form of rectangles with definite fields. At the upper part of the rectangle the key information of the entity, also called the primary key, is located. This information is selected for unique entity identification, e.g. ID of a computer. At the lower part an area with non key attributes is located, e.g. the name of the computer in the network, the current worker, who works with the computer, works fulfilled on the given computer and computer characteristics. At the left bottom part an area with the entity name on the diagram is located, e.g. COMPUTER, WORKER or DEPARTMENT.
In the capacity of key attributes several attributes or even attribute groups can be chosen. Attributes, which can be key attributes, are called candidates of key attributes. Key attributes selection rules consist in the following:
- Key attributes must uniquely identify an entity;
- Key attributes mustn’t contain empty or NULL values;
- Key attributes can’t change with time. At key attributes change the entity changes also;
- Key attributes must be brief as far as possible for convenience of the further processing or indexation. For instance these can be alphanumeric symbols of the entity ID.
At choice of the primary key it is often used the so-called surrogate key, which represents an arbitrary number, existing only within the limits of the concrete data base and is unique for each
If entities on the IDEF1x diagram are connected one to each other, then the parent entity transfers key attributes to a child entity. Such attributes are called migratory or external keys. For example, COMPUTER which is on DEPARTMENT balance will have as an external key one of its key attributes the DEPARTMENT ID. Such child entities are called dependent as their identification depends on the key attributes of the parent entity. Dependent entities are divided into those entities which cannot exist without parent entity and those that can’t be identified without parent entity. For example, the INFORMATION on the COMPUTER cannot exist without it or without an external carrier, which are parent entities for it. In its turn, COMPUTER can exist without a DEPARTMENT, but accordingly to the accepted notations, cannot be identified not being the part of any department. Independent entities are those which are not dependent in identification on other entities. These are entities into which the system is divided in the first place and further structuring will happen within the limits of these entities. For example as a rule an organization is divided into DEPARTMENTS which are independent entities as they have its unique identifier not dependent on other entities. All other entities in their identification will depend on ID of the department they belong to.
Accordingly to IDEF1x standard, dependent entities are represented in the form of rounded rectangles, and non-dependent – in the form of usual rectangles.
The ties between entities can be identifying (transferring the external key to a child entity) and non-identifying (transferring data to the area of child entity data). Identifying ties are represented with a solid line, and non-identifying- with dotted line. As an example of identifying tie can be the tie between the DEPARTMENT and any of the resources, which is allotted between DEPARTMENTS and belong not to any of the DEPARTMENTS but to the organization as a whole.
The main advantage of the IDEF1X is the rigid and strict standardization of modeling. Such standardization allows to avoid misunderstandings during the analysis of the constructed model which is the significant advantage against other modeling methods without data bases.
_Win_Mac.png)