How to Draw Pictorial Chart.
How to Use Infograms
How to Draw Pictorial Chart
How to draw pictorial chart quick, easy and effective? ConceptDraw DIAGRAM offers the unique Pictorial Infographics Solution that will help you!
ConceptDraw DIAGRAM diagramming and vector drawing software extended with Pictorial Infographics Solution from the “What is Infographics” Area is a best choice for those who want draw pictorial chart and design pictorial infographics.
Pictorial Infographics solution contains large number of libraries with variety of predesigned vector pictograms that allows you design infographics in minutes. There are available 10 libraries with 197 vector pictograms:
- Business People Pictograms
- Computer Pictograms
- Office Pictograms
- People Pictograms
- Medicine and Health Pictograms
- Ecology Pictograms
- Transport Pictograms
- Travel and Tourism Pictograms
- Shopping Pictogram
- Time and Clock Pictograms

Pic. 1. Design Pictorial Infographics
Simply drag the needed pictograms to your chart to make it attractive and successful. You can use the pictograms separately, or even combine them as you like in the compositions, copy / paste and rotate pictograms, etc.

Pic. 2. Design Infographics
ConceptDraw DIAGRAM also gives you the useful possibility to make your infographics colorful! When you design infographics, simply click the pictogram at the document and apply the desired color from the palette to color it.

Pic 3. How to Draw Pictorial Chart
Pictorial Infographics solution provides also large quantity of sample infographics, sample pictorial chart and templates allowing anyone design pictorial infographics of any complexity in a few minutes.
How to Use Infograms
How to use infograms? Everyone loves infograms. It is a simple and understandable way for representing complex information and data in a visual graphical form. Infograms are very popular and widely used almost in any sphere of life activity, particularly in:
- education
- statistics
- business
- geography
- medicine
- journalism, etc.

Pic 4. How to Use Infograms
This sample pictorial chart was created in ConceptDraw DIAGRAM using the Computer Pictograms, Ecology Pictograms, and People Pictograms Libraries from the Pictorial Infographics Solution and illustrates the statistics of computer and internet use in the United States.
Solution Pictorial Infographics from ConceptDraw Solution Park extends ConceptDraw DIAGRAM ector diagramming and business graphics software with easy-to-use design pictorial infographics drawing tools.
Use Pictorial Infographics solution for quickly and easy design pictorial infographics documents and then successfully use them for your needs.
TEN RELATED HOW TO's:
ConceptDraw DIAGRAM creates drawings, diagrams and charts with great visual appeal in Mac OS X.
Picture: Best Vector Drawing Application for Mac OS X
Related Solution:
UML Collaboration Diagram depicts the interactions between objects or parts in terms of sequenced messages and describes both the static structure and dynamic behavior of a system.
Rapid UML solution provides templates, examples and libraries of stencils for quick and easy drawing all the types of system and software engineering diagrams according to UML 2.4 and 1.2 notations.
Picture: UML Collaboration Diagram (UML2.0)
Related Solution:
Genetic engineering is moving in a rapid fashion. There are new discoveries occurring at an incredibly fast pace.
This map was created from content found at "FAQ About Genetic and Genomic Science" (National Human Genome Research Institute, www.genome.gov) and shows how simple in is to use a map structure to explain complex subjects. The content from this map and maps similar to this can be used with the eLearning for Skype solution for ConceptDraw MINDMAP to present complex information in a simplified manner.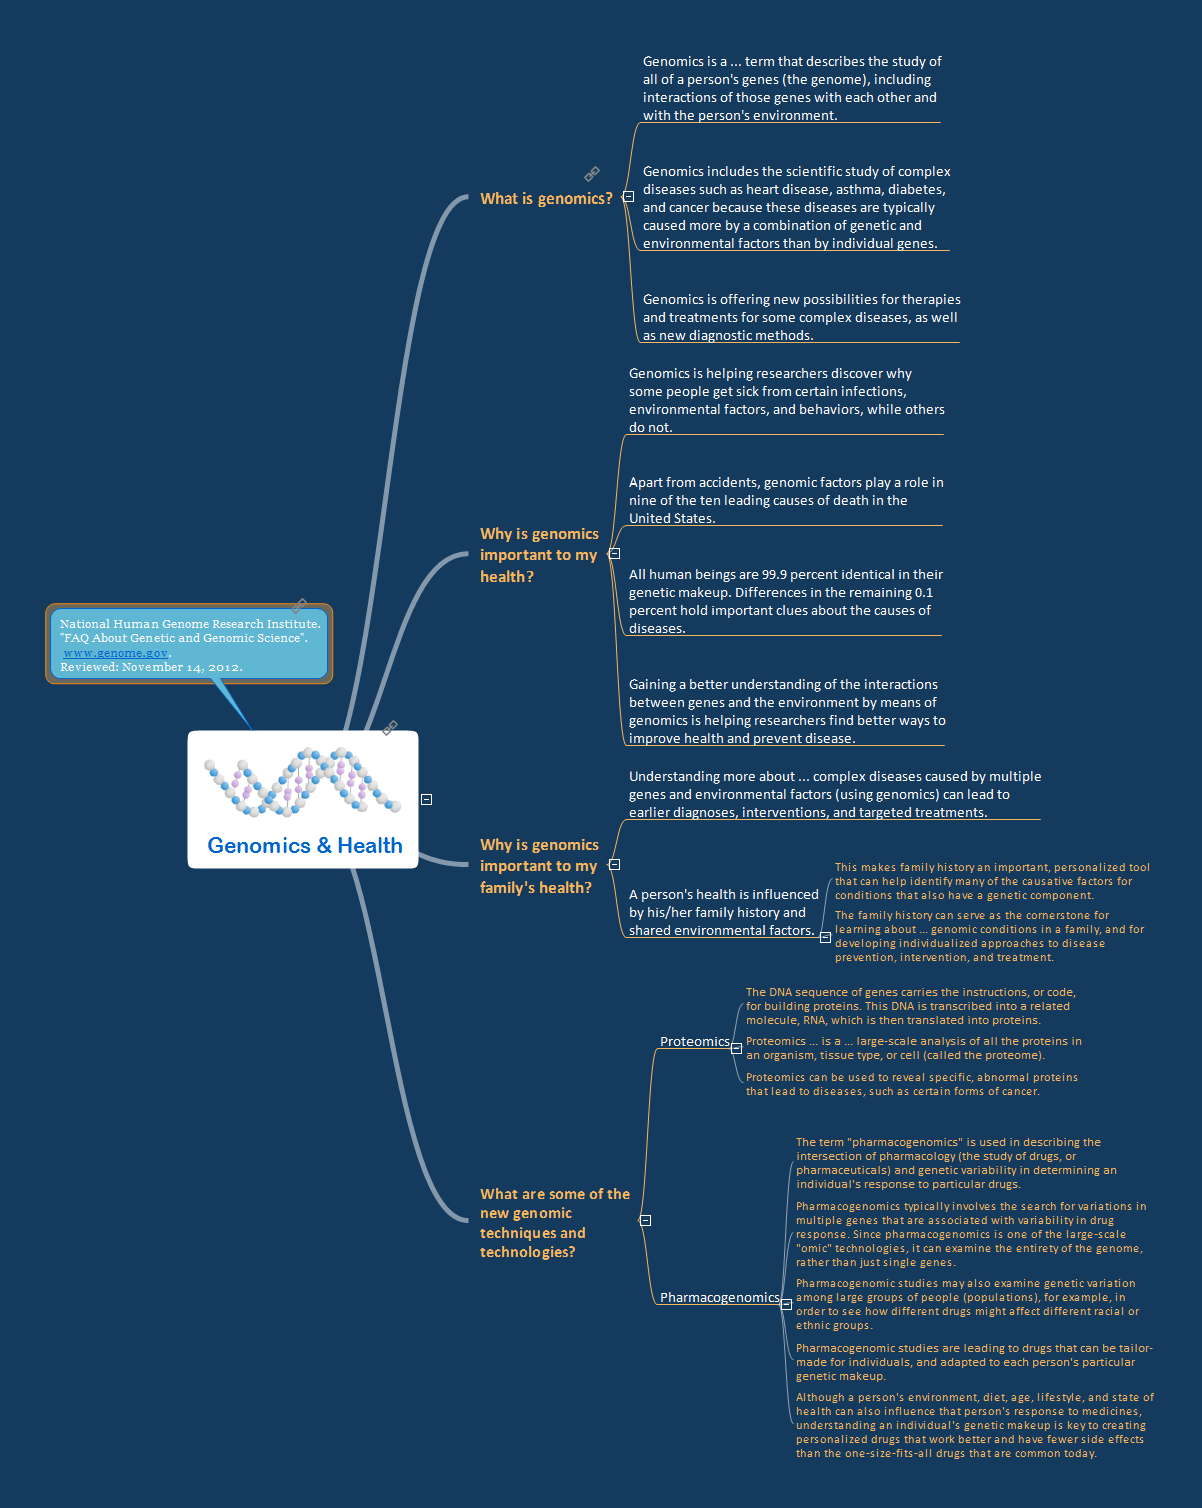
Picture: Genomics
Related Solution:
ConceptDraw DIAGRAM is a powerful intelligent vector graphics engine that can be used to create basic diagrams including flowcharts, charts, workflows, flowcharts, organizational charts, business diagram, learn business diagrams, flow diagrams.
Picture: The Best Mac Software for Diagramming or Drawing
Related Solution:
Onion diagram is a type of circular diagram that consists of the core circle representing the product/solution and concentric circles around it, which dependent on the core and look like the cross sections of onion.
ConceptDraw DIAGRAM diagramming and vector drawing software supplied with Stakeholder Onion Diagrams Solution from the Management Area of ConceptDraw Solution Park is an ideal software for effective Onion diagram process design.
Picture: Onion Diagram Process Design
Related Solution:
There are a lot of structured analysis and design technique methodologies used to describe systems and data sources. To visualize data structures, data flow diagrams can be used for various purposes in the area of software engineering. Nowadays these diagrams are also used in the area of business analysis and information system analysis.
This data flow diagram depicts an account processing system of a typical account department of a small manufacturing enterprise. It shows the data transmission through the order processing to shipping verification. This data flow diagram was created according to standard of Yourdon and Coad notation. The vector graphic objects of Yourdon/Coad notation symbols was delivered by ConceptDraw Data Flow Diagrams solution. The current DFD can be employed as an example of a business process model, representing the set of business events and interactions commonly engaged in a accounts receivable process.
Picture: Data Flow Diagrams
Related Solution:
Create a Line Chart with ConceptDraw using our tips. Here you can find an explanation of how to create a line chart quickly.
Picture: How to Create a Line Chart
Related Solution:

