Products
Solutions
Samples
Contact Us
Buy
Helpdesk
✕
Sign In
Sign In
My ConceptDraw
Profile
Cart 
Activate
My Activated Licenses
Upgrade Information
Download Product
Open Support Ticket
Sign Out
This site uses cookies. By continuing to browse the ConceptDraw site you are agreeing to our Use of Site Cookies.
Helpdesk  >  ConceptDraw DIAGRAM  >    Business-specific Drawings

How to Create Agriculture Infographics

Creating agriculture infographics involves visual representation of data, processes, and concepts related to farming, crop production, livestock management, and sustainability.

These sample infographics were created using the Agriculture Infographics solution for ConceptDraw DIAGRAM. When creating or using infographics and diagrams related to Critical Infrastructure Sectors, consider the following steps.
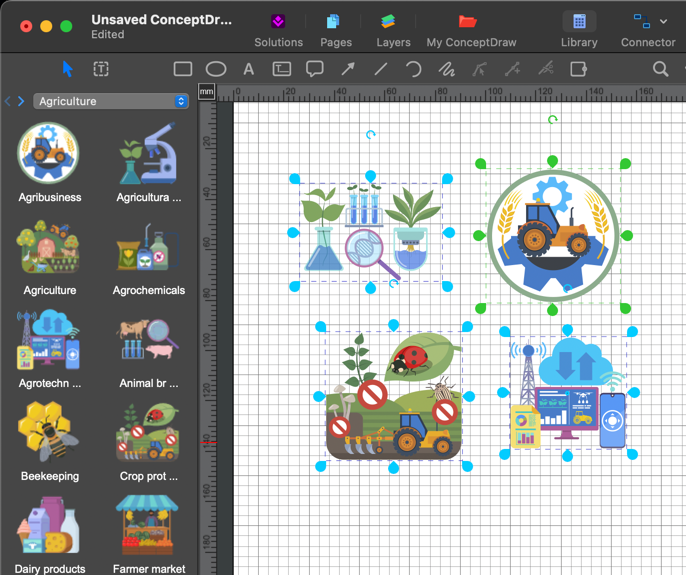
  1. Run ConceptDraw DIAGRAM.
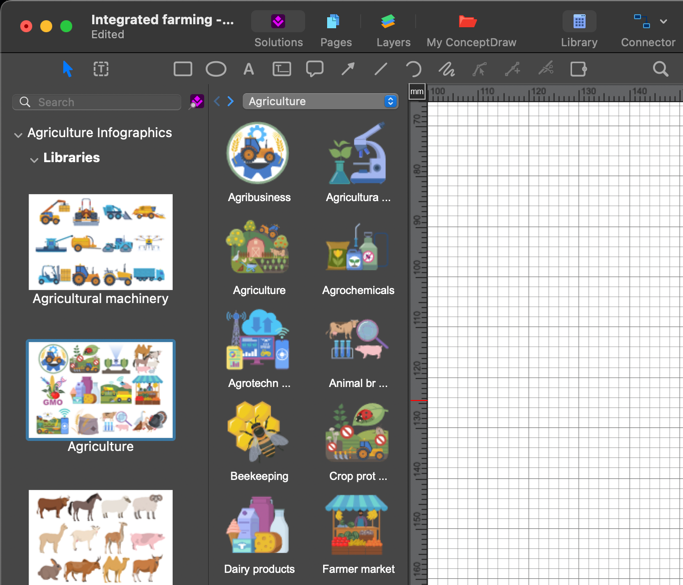
  2. Reveal the Agriculture Infographics libraries in the Solutions panel.
  3. conceptdraw-agriculture-infographics-solution
  4. Determine the key points and information you want to convey. Use visual elements: employ icons, symbols, and images to represent it. Visual elements enhance understanding and make the information more memorable.
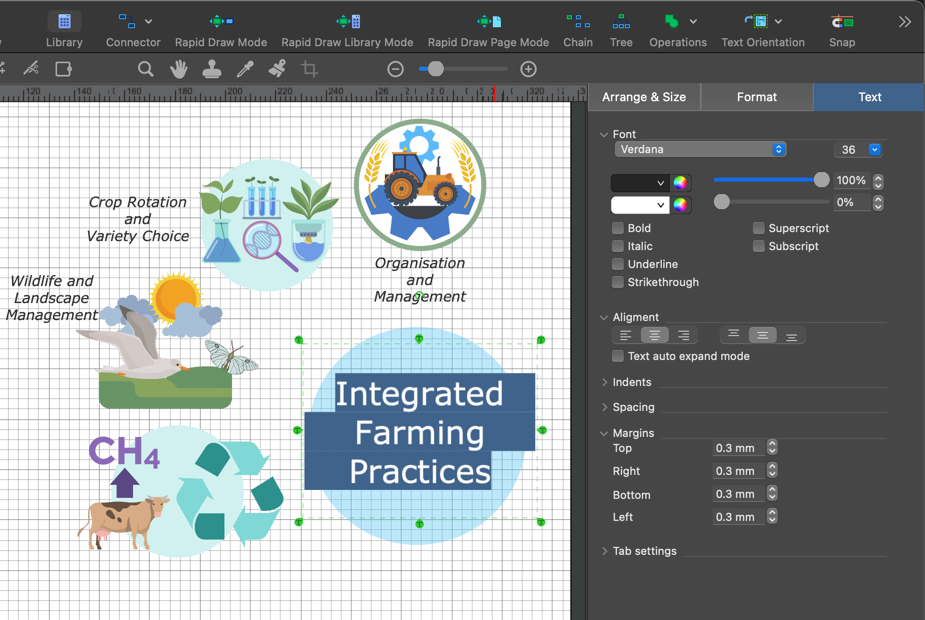
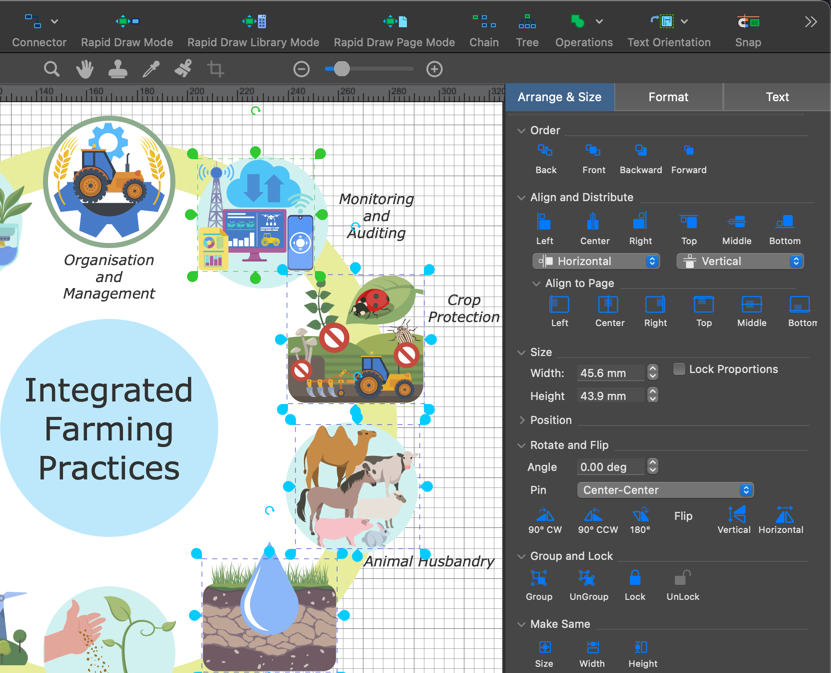
  5. Drag and drop the needed objects from the library to a document page. You can even import your images to customize your drawing.
  6. conceptdraw-agriculture-infographics-vector
  7. Add text — to activate the Text Tool select an object and start typing. To finish, click on an empty area on the page or press ESC.
  8. conceptdraw-agriculture-infographics-design
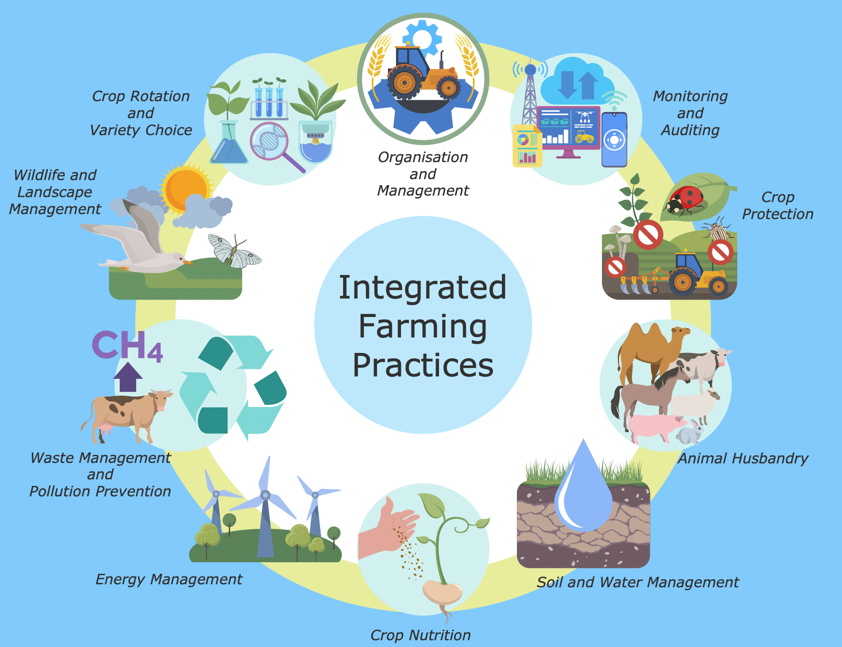
  9. Organize Information clearly: arrange it logically. In our case, we chose a radial structure to show the farm and its environmental surroundings as a single whole.
  10. conceptdraw-agriculture-infographics-software

Result: This sample diagram was created in ConceptDraw DIAGRAM using the combination of libraries from the Agriculture Infographics solution. Approximately 15 minutes of your time will be required for the creation of such professional-looking graphics. Any of the sample ConceptDraw documents that come with Solutions can be used as a good starting point for creating your diagrams.

conceptdraw-agriculture-infographics-design-software

How it works:

  • Set of ready-to-use templates supplied with ConceptDraw DIAGRAM
  • Collection of professional samples supports each template

Useful Solutions and Products:

Diagrams Area
  • Block Diagrams
  • Bubble Diagrams
  • Circle-Spoke Diagrams
  • Circular Arrows Diagrams
  • Concept Maps
  • Flowcharts

Business Infographics
  • Marketing Infographics
  • Management Infographics
  • Education Infographics
  • Financial Infographics
  • Business Infographics samples
  • Business Infographics Tool

ConceptDraw DIAGRAM
  • Diagraming and Charts
  • Vector Illustrations
  • Maps
  • Floor plans
  • Engineering drawings
  • Business dashboards
  • Infographics
  • Presentation
  • Over 10 000 vector stencils
  • Export to vector graphics files
  • Export to Adobe Acrobat® PDF
  • Export to MS PowerPoint®
  • Export to MS Visio® VSDX, VDX

Products

  • ConceptDraw OFFICE v11
  • ConceptDraw DIAGRAM v18
  • ConceptDraw MINDMAP v16
  • ConceptDraw PROJECT v15
  • ConceptDraw STORE
  • ConceptDraw BOOKS

Solutions

  • Free
  • Premium

Samples

Support

  • Technical Support
  • Upgrade Request
  • Visio File Conversion
  • System Requirements
  • Helpdesk
  • Students & Educators
  • Enterprise
  • Customer Service

Solutions

  • Free
  • Premium

Samples

Video Room

  • Products
  • Solutions

Ready To Buy

  • Buy Online
  • Reseller Partners
  • Manage Your Account
  • Download Your Software
  • CS Odessa

    • About Us
    • Contact Us
    • CS Odessa Identity
    • News
  • CS Odessa
    Plan. Do. Communicate.

    About Us | Contact Us | Feedback | EULA | Privacy | TOU | TOS
    © 1993 — 2025 CS Odessa Corp.