HelpDesk
How to Set Line Jumps for Smart Connectors in ConceptDraw PRO
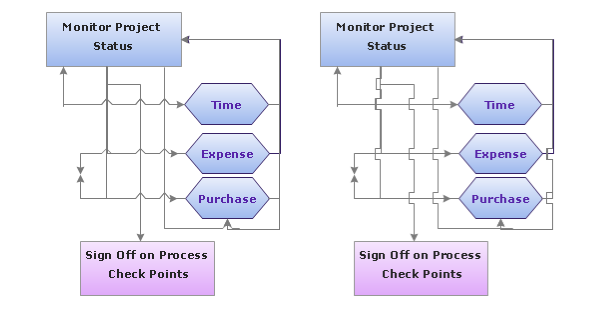
Connecting objects in ConceptDraw PRO is an easy task. You can use Chain, or Tree connection mode for automatic connection of multiple objects. Besides the automatic connection modes, ConceptDraw PRO offers few options to connect objects manually: Direct, Arc, Bezier, Smart, Curve and Round Connectors. You can make them square, arched or angled and also set vertical or horizontal orientation Thus, you can control how the jumps and orientation occurs on smart connectors. When two smart connectors cross each other you can control how the two intersecting lines look.Line Graph Charting Software
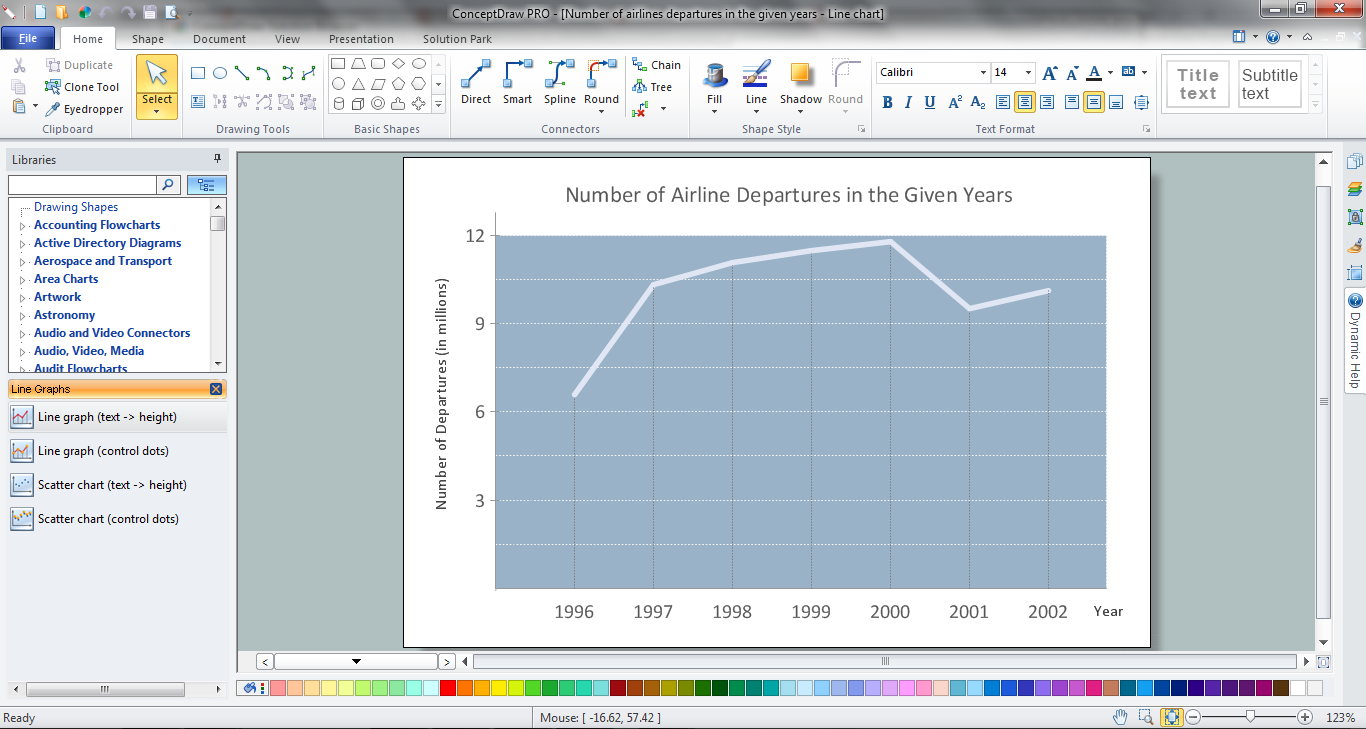
To design line and scatter charts use ConceptDraw PRO diagramming and vector drawing software extended with Line Graphs solution from Graphs and Charts area of ConceptDraw PRO Solution Park. (Line chart, scatter chart, 2d chart).
 Line Graphs
How to draw a Line Graph with ease? The Line Graphs solution extends the capabilities of ConceptDraw PRO v10 with professionally designed templates, samples, and a library of vector stencils for drawing perfect Line Graphs.
Line Chart Examples
The Line Graphs solution from Graphs and Charts area of ConceptDraw Solution Park contains a set of examples, templates and design elements library of line and scatter charts. Use it to draw line and scatter graphs using ConceptDraw PRO diagramming and vector drawing software for illustrating your documents, presentations and websites.Ice Hockey Rink Dimensions
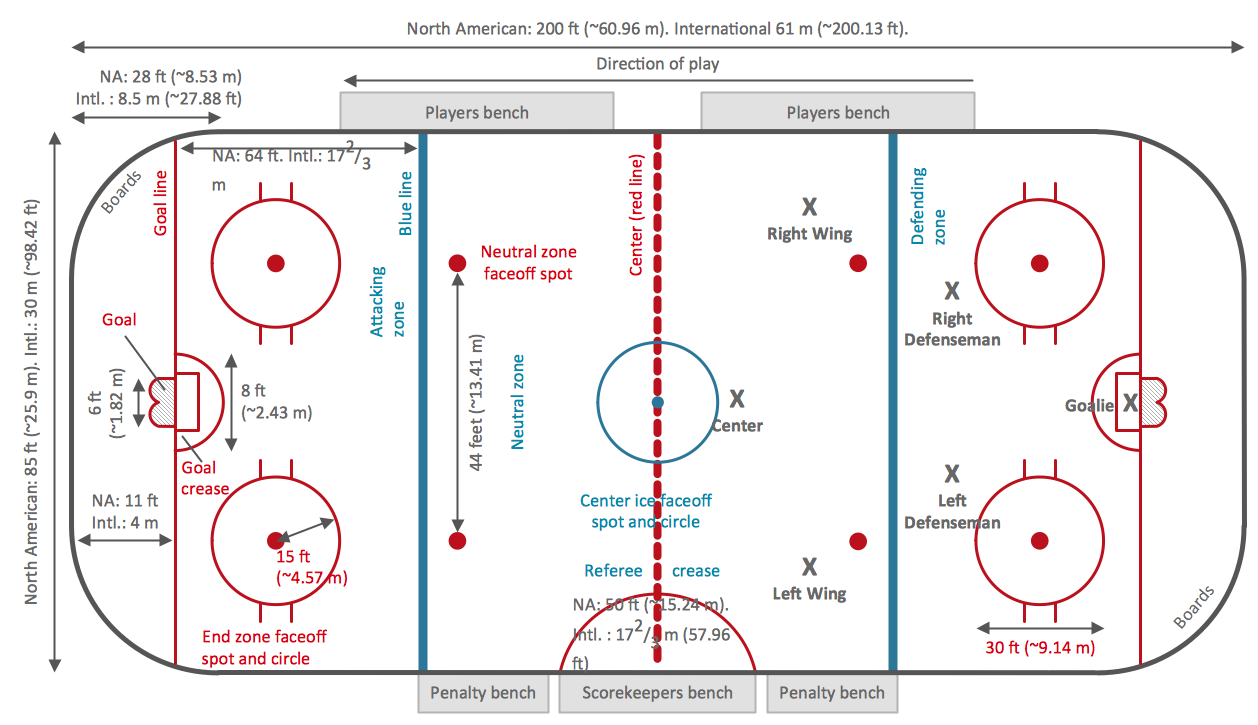
Meeting ice hockey rules one should learn ice hockey rink terms, lines, zones etc. ConceptDraw PRO is an advanced drawing software that allows you produce ice hockey rink depiction of any complexity, from simple sketch drawing to detailed one as on example below.Line Chart Template for Word
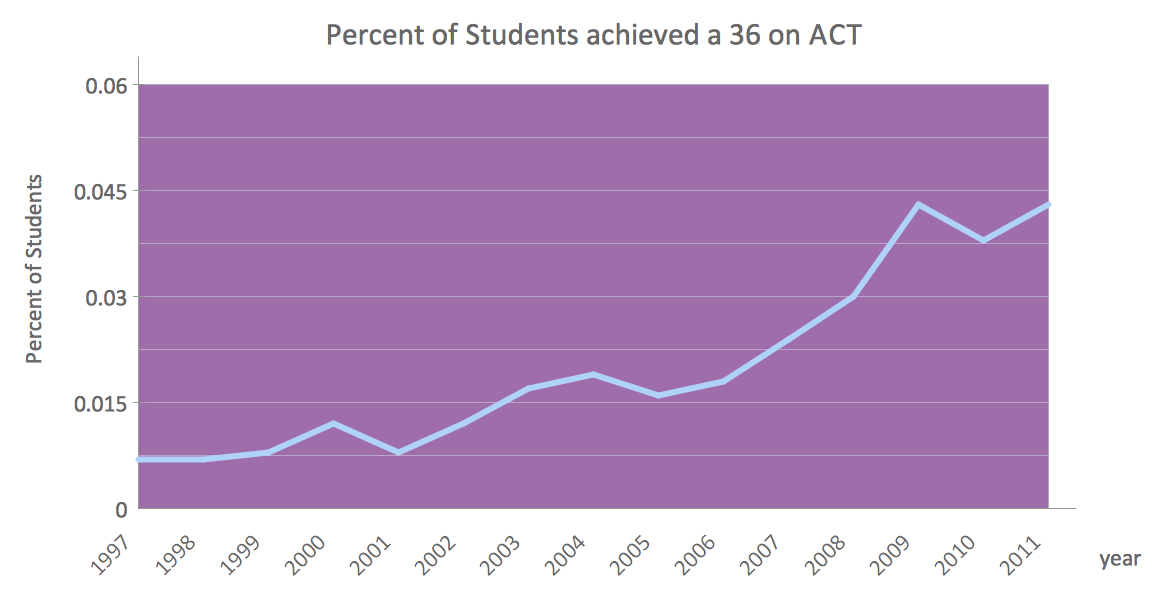
This sample was created in ConceptDraw PRO diagramming and vector drawing software using the Line Graphs Solution from Graphs and Charts area of ConceptDraw Solution Park. This sample shows the Line Chart of annual percentage change. The Line Chart allows you to clearly see the changes of data over the time.HelpDesk
How to Draw a Line Chart Quickly
A common line chart is a graphical representation of the functional relationship between two series of data. A line chart that is created by connecting a series of data points together with a straight line is the most basic type of a line chart. A line chart can be used for depicting data that changes continuously over time. It is extensively utilized in statistics, marketing and financial business. ConceptDraw Line Graph solution provides the possibility to make 2D line charts quickly and effortlessly.How to Create a Line Chart
Create a Line Chart with ConceptDraw using our tips. Here you can find an explanation of how to create a line chart quickly.
 Basic Line Graphs
This solution extends the capabilities of ConceptDraw PRO v10.3.0 (or later) with templates, samples and a library of vector stencils for drawing Line Graphs.
HelpDesk
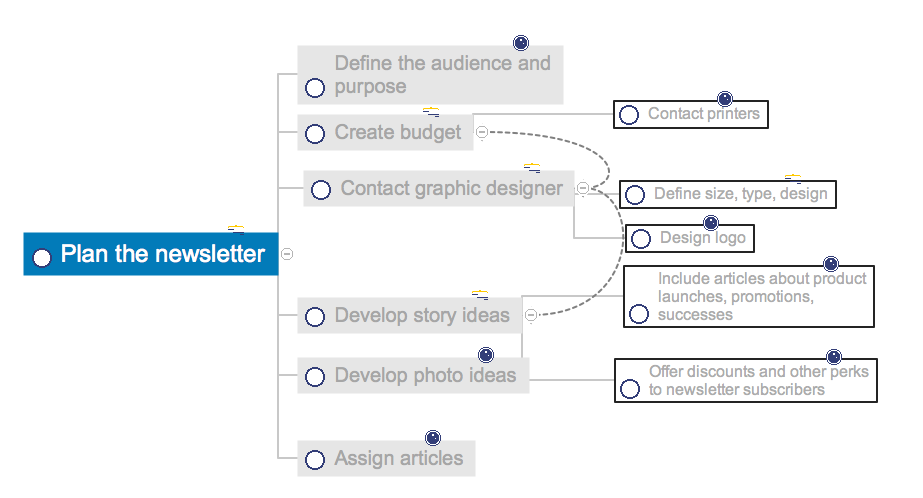
How to Change the Form and Color of a Topic’s Line in Your Mind Map
You can completely customize the style of your mind maps, including the style of topic lines and outlines. This article describes how to change the form and color of a topic’s line in your mind map.How to Draw a Line Graph
In your work activity you need regularly draw the line graphs? And each time you ask yourself a question "How to Draw a Line Graph easier and faster?". The desire to automate the line graphs drawing process led to the creation of Line Graphs solution from Graphs and Charts area of ConceptDraw Solution Park.Line Graph
ConceptDraw PRO extended with Line Graphs solution from Graphs and Charts area of ConceptDraw Solution Park is ideal software for quick and simple drawing professional looking line graph.Line Charts
ConceptDraw PRO diagramming and vector drawing software extended with Line Graphs solution from the Graphs and Charts area of ConceptDraw Solution Park is the best for drawing the Line Charts simply and fast.Line Chart
You want to draw the Line Chart and need the automated tool? Now it is reality with Line Graphs solution from Graphs and Charts area of ConceptDraw Solution Park.What Is a Line Chart
What Is a Line Chart? A line chart is a basic type of chart represented by a series of data points connected with a straight line. Explaining the meaning of “What is a line chart?” is convenient to use illustrations with professional looking line charts designed in ConceptDraw PRO diagramming and vector drawing software extended with Line Graphs solution from the Graphs and Charts area.- Bar Graphs | Picture Graphs | Line Graphs | Graphs
- Line Chart Examples | Line Chart Template for Word | How to Create ...
- ERD Symbols and Meanings | Entity Relationship Diagram Symbols ...
- Line Chart Template for Word
- Timeline Diagrams | How to Make a Timeline | Timeline Diagrams ...
- Line Graph Of Population
- Line Graphs | How to Draw a Line Graph | Line Graph Charting ...
- Line graph - Template
- Line Chart Template for Word | Basic Diagramming | Line Charts ...
- Drawing Of Building By Line Diagram
- Evolution of the population | Examples Of Divergence Line Graph
- Line Graph Charting Software | Line Chart Template for Word | Pie ...
- Line Chart Examples | Pictures of Graphs | Types of Flowchart ...
- Line Graphs And Charts
- How to Draw a Line Graph | Line Graph | Picture Graph | Images Of ...
- Line Graphs
- Sales Growth. Bar Graphs Example | Bar Chart Examples | Bar ...
- Line Graph Charting Software | Line Graphs | How to Draw a Line ...
- Sample Pictorial Chart. Sample Infographics | Pictorial Chart | Line ...
- Line graphs - Vector stencils library
