Event-driven Process Chain Diagrams
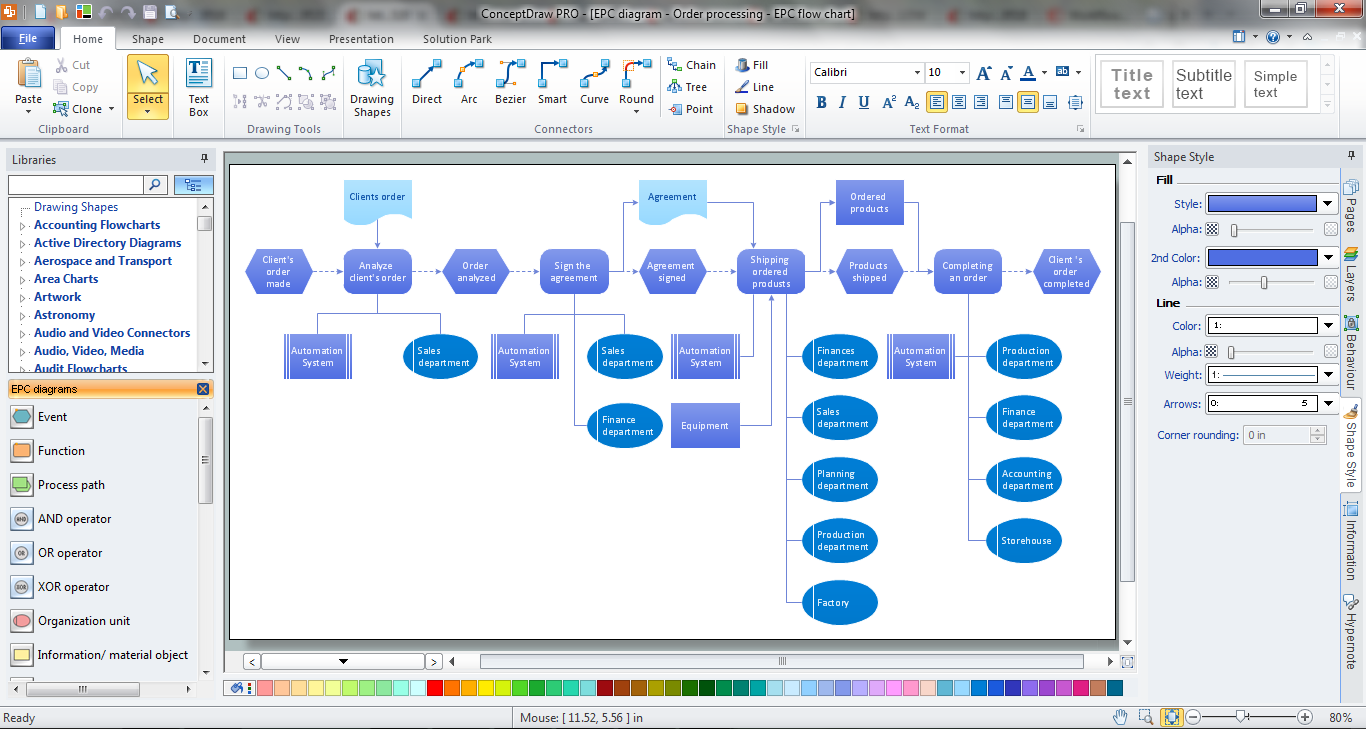
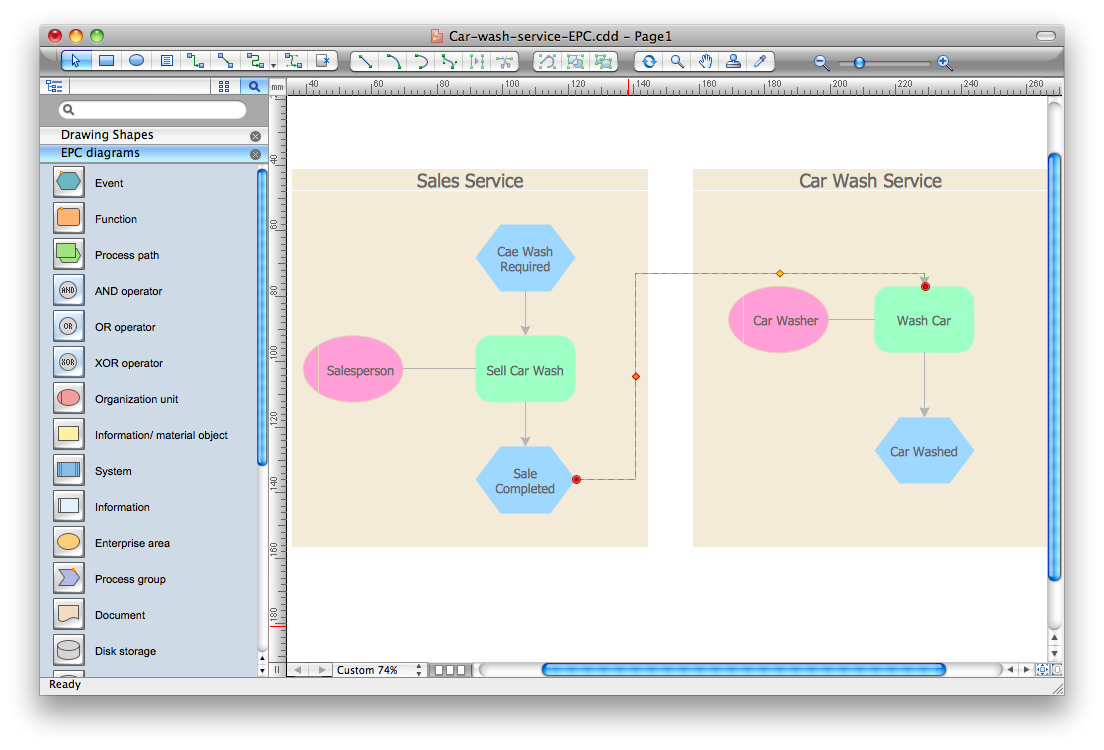
Event-Driven Process Chain Diagrams solution extends ConceptDraw DIAGRAM functionality with event driven process chain templates, samples of EPC engineering and modeling the business processes, and a vector shape library for drawing the EPC diagrams and EPC flowcharts of any complexity. It is one of EPC IT solutions that assist the marketing experts, business specialists, engineers, educators and researchers in resources planning and improving the business processes using the EPC flowchart or EPC diagram. Use the EPC solutions tools to construct the chain of events and functions, to illustrate the structure of a business process control flow, to describe people and tasks for execution the business processes, to identify the inefficient businesses processes and measures required to make them efficient.
IDEF3 Standard
Use Case Diagrams technology. IDEF3 Standard is intended for description and further analysis of technological processes of an enterprise. Using IDEF3 standard it is possible to examine and model scenarios of technological processes.Types of Flowcharts
A Flowchart is a graphically representation of the process, algorithm or the step-by-step solution of the problem. There are ten types of Flowcharts. Using the Flowcharts solution from the Diagrams area of ConceptDraw Solution Park you can easy and quickly design the Flowchart of any of these types.Business process Flow Chart — Event-Driven Process chain (EPC) diagrams
Event-Driven Process chain Diagrams for improvement throughout an organisation. Best software for Process Flow Diagram. The Event-driven Process Chain (EPC) Diagrams allows managers to plan processes and resources.ERD Symbols and Meanings
Crow's foot notation is used in Barker's Notation, Structured Systems Analysis and Design Method (SSADM) and information engineering. Crow's foot diagrams represent entities as boxes, and relationships as lines between the boxes. Different shapes at the ends of these lines represent the cardinality of the relationship.The Chen's ERD notation is still used and is considered to present a more detailed way of representing entities and relationships.
To create an ERD, software engineers mainly turn to dedicated drawing software, which contain the full notation resources for their specific database design - ERD symbols and meanings. CS Odessa has released an all-inclusive Entity-Relationship Diagram (ERD) solution for their powerful drawing program, ConceptDraw DIAGRAM.
Process Flowcharts
This solution extends ConceptDraw DIAGRAM software with templates, samples, and library of vector shapes for drawing the Process Flowcharts.
EPC IT Solutions
EPC IT Solutions are very popular now for drawing various EPC diagrams which are widely used for modeling and analyzing the business processes. ConceptDraw DIAGRAM software is not exception and provides the powerful Event-driven Process Chain Diagrams EPC solution from the Business Processes Area.EPC is an ordered graph of events and functions that allows alternative and parallel execution of processes owing to use of connectors and logical operators OR, AND, XOR.
Types of Flowchart - Overview
When designing a process or an instruction in clear way, you should consider creating a flowchart. A Process Flow Diagram is the method. You can avoid wasting a lot of time understanding complex concepts as they get clear with different diagrams.HelpDesk
How to Create a Fault Tree Analysis Diagram (FTD)
Fault Tree Diagram is a logic diagram that shows the state of an entire system in a relationship of the conditions of its elements. Fault Tree Diagram is used to analyze the probability of functional system failures and safety accidents. ConceptDraw DIAGRAM allows you to create professional Fault Tree Diagrams using the basic FTD symbols. An FTD visualizes a model of the processes within a system that can lead to the unlikely event. A fault tree diagrams are created using standard logic symbols. The basic elements in a fault tree diagram are gates and events.Event-Driven Process Chain Diagram Software
It’s very easy, quick and convenient to draw the Event-driven Process Chain (EPC) diagrams in ConceptDraw DIAGRAM diagramming and vector drawing software using the Event-driven Process Chain Diagrams Solution from the Business Processes area of ConceptDraw Solution Park.- Types of Flowcharts | How to Create a Fault Tree Analysis Diagram ...
- Xor Flowchart
- Deference Between And And Xor Flowchart Symbols
- Types of Flowcharts | BPMN | Process Flowchart Symbols ...
- Types of Flowcharts | Xor Indicator In Flowchart
- Basic Flowchart Symbols and Meaning | Design elements ...
- Bpmn 2 0 Xor Gateway Alternative
- Xor
- Vector stencils library - IDEF3 process schematic symbols | Vector ...
- EPC diagrams - Vector stencils library | Project management life ...
- ERD | Entity Relationship Diagrams, ERD Software for Mac and Win
- Flowchart | Basic Flowchart Symbols and Meaning
- Flowchart | Flowchart Design - Symbols, Shapes, Stencils and Icons
- Flowchart | Flow Chart Symbols
- Electrical | Electrical Drawing - Wiring and Circuits Schematics
- Flowchart | Common Flowchart Symbols