This cause and effect diagram sample was redesigned from the Wikimedia Commons file: Fishbone BadCoffeeExample.jpg. [commons.wikimedia.org/ wiki/ File:Fishbone_ BadCoffeeExample.jpg]
This file is licensed under the Creative Commons Attribution-Share Alike 3.0 Unported license. [creativecommons.org/ licenses/ by-sa/ 3.0/ deed.en]
The fishbone diagram example "Bad coffee" was created using the ConceptDraw PRO diagramming and vector drawing software extended with the Fishbone Diagrams solution from the Management area of ConceptDraw Solution Park.
Fishbone diagram

This cause-and-effect diagram example was redesigned from the Wikimedia Commons file: Ishikawa Fishbone Diagram.svg. [commons.wikimedia.org/ wiki/ File:Ishikawa_ Fishbone_ Diagram.svg]
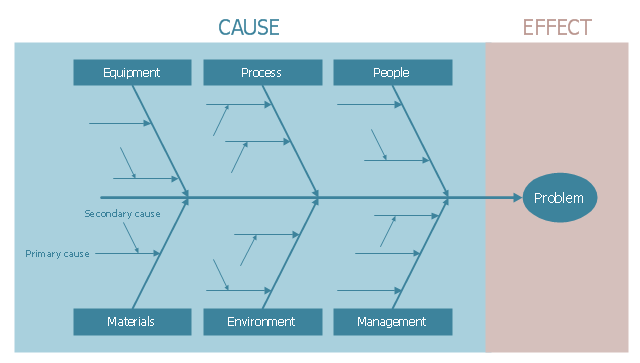
"Ishikawa diagrams (also called fishbone diagrams, herringbone diagrams, cause-and-effect diagrams, or Fishikawa) are causal diagrams created by Kaoru Ishikawa (1968) that show the causes of a specific event. Common uses of the Ishikawa diagram are product design and quality defect prevention to identify potential factors causing an overall effect. Each cause or reason for imperfection is a source of variation. Causes are usually grouped into major categories to identify these sources of variation. The categories typically include
- People: Anyone involved with the process
- Methods: How the process is performed and the specific requirements for doing it, such as policies, procedures, rules, regulations and laws
- Machines: Any equipment, computers, tools, etc. required to accomplish the job
- Materials: Raw materials, parts, pens, paper, etc. used to produce the final product
- Measurements: Data generated from the process that are used to evaluate its quality
- Environment: The conditions, such as location, time, temperature, and culture in which the process operates" [Ishikawa diagram. Wikipedia]
The example "Ishikawa fishbone diagram" was created using the ConceptDraw PRO software extended with the Seven Basic Tools of Quality solution from the Quality area of ConceptDraw Solution Park.
Cause-and-effect diagram example
Draw Fishbone Diagram on MAC Software

Fishbone Diagram Example

Fishbone Diagram Problem Solving

Fishbone Diagram Design Element
.png)
ConceptDraw DIAGRAM - Organizational chart software

Crea Diagramas De Flujo
Draw Diagram on Mac
Total Quality Management with ConceptDraw

- Ishikawa fishbone diagram | Fishbone diagram - Bad coffee | Cause ...
- Fishbone Diagram | Business diagrams & Org Charts with ...
- Fishbone diagram - Bad coffee | Artwork | Holiday | Fishbone ...
- Accounting Flowcharts | Fishbone Diagram | Examples of Flowcharts ...
- Ishikawa fishbone diagram | Fishbone diagram - Bad coffee | Design ...
- Wiki Fishbone Diagram
- Fishbone diagram - Template | Manufacturing 8 Ms fishbone ...
- Fishbone diagram - Bad coffee | Fishbone Diagrams | Cafe and ...
- Cause and effect diagram - Increase in productivity | Fishbone ...
- Fishbone diagram - Bad coffee | Fishbone Diagrams | Cause and ...