Network Diagram Software. LAN Network Diagrams. Physical Office Network Diagrams
Physical LAN Diagrams illustrate the communication schemes of Local Area Networks, the physical network connection of computers and networks arrangement on the small areas - at homes, offices, and other buildings. ConceptDraw DIAGRAM is a perfect network diagramming software with samples and examples of WAN and LAN Diagrams, templates and collection of network components libraries. Computer Network Diagrams Solution for ConceptDraw DIAGRAM Mac and Windows is ideal for IT professionals, network engineers and network designers who need to visualize network architecture, to document LANs physical structure and arrangement, to draw Local Area Network (LAN) diagrams and schematics, WAN diagrams, physical office network diagrams and topologies, wiring drawings, etc. You can design all them easy using the predesigned vector objects of computers and computer network devices, hardware devices, peripheral devices, external digital devices, internet and logical symbols, and many other stencils from the Computer Network Diagrams libraries. ConceptDraw DIAGRAM offers a powerful and easy-to-use solution for those who looking for a Visio alternative for Mac. It is a world-class diagramming platform with dynamic presentation power.
UML Activity Diagram. Design Elements
UML Activity Diagram illustrate the business and operational step-by-step workflow of components in a system and shows the overall flow of control.
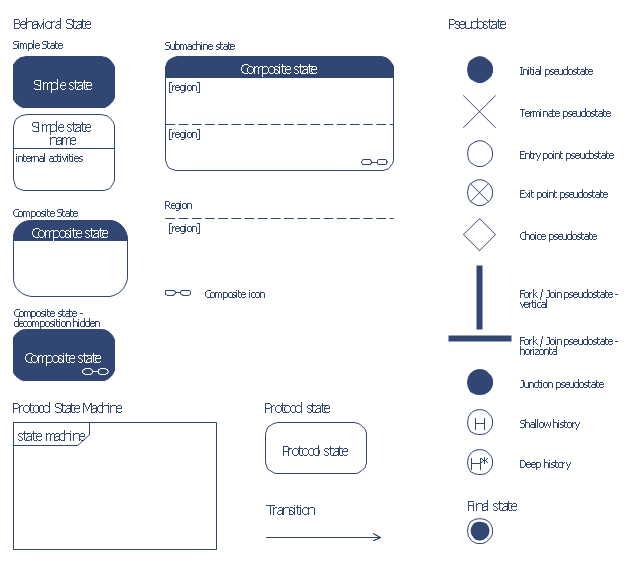
The vector stencils library "Bank UML state machine diagram" contains 21 shapes for drawing UML state machine diagrams.
Use it for object-oriented modeling of your bank information system.
"The state diagram in the Unified Modeling Language is essentially a Harel statechart with standardized notation, which can describe many systems, from computer programs to business processes. In UML 2 the name has been changed to State Machine Diagram. The following are the basic notational elements that can be used to make up a diagram:
* Filled circle, pointing to the initial state.
* Hollow circle containing a smaller filled circle, indicating the final state (if any).
* Rounded rectangle, denoting a state. Top of the rectangle contains a name of the state. Can contain a horizontal line in the middle, below which the activities that are done in that state are indicated.
* Arrow, denoting transition. The name of the event (if any) causing this transition labels the arrow body. A guard expression may be added before a "/ " and enclosed in square-brackets ( eventName[guardExpression] ), denoting that this expression must be true for the transition to take place. If an action is performed during this transition, it is added to the label following a "/ " ( eventName[guardExpression]/ action ).
* Thick horizontal line with either x>1 lines entering and 1 line leaving or 1 line entering and x>1 lines leaving. These denote join/ fork, respectively." [State machine diagram. Wikipedia]
This example of UML state machine diagram symbols for the ConceptDraw PRO diagramming and vector drawing software is included in the ATM UML Diagrams solution from the Software Development area of ConceptDraw Solution Park.
Use a Fishbone Diagram to Attack Complex Problems
Any project is a complex system which rarely goes without some problems, even the most minor. But the success of the project mostly depends from the ability effectively solve appearing problems. There are many methods for problem solving, one of the most effective is the use a Fishbone diagram to attack complex problems. Use ConceptDraw DIAGRAM diagramming software with Fishbone Diagrams Solution to attack any complex problems with fishbone diagrams graphic method. Construct Fishbone diagram to help users brainstorm and break down a complex problem.Data Modeling Diagram
The vector stencils library Activity diagrams from the solution Rapid UML contains specific data modeling symbols for ConceptDraw DIAGRAM diagramming and vector drawing software. The Rapid UML solution is contained in the Software Development area of ConceptDraw Solution Park.Entity Relationship Diagram Symbols
The semantic modeling method nowadays is successfully applied in database structure design. It is effective method of modeling the data structures, which is based on the meaning of these data. As a tool of semantic modeling, there are used different types of Entity-Relationship Diagrams. Entity Relationship Diagram (ERD) is applied to visually and clearly represent a structure of a business database. The main components of ERDs are: entity, relation and attributes. An entity is a class of similar objects in the model, each entity is depicted in the form of rectangle and has the name expressed by a noun. Relation is shown in the form of non-directional line that connects two entities. There are several notation styles used for ERDs: information engineering style, Chen style, Bachman style, Martin Style. The Entity Relationship Diagram symbols used for professional ERD drawing are predesigned by professionals and collected in the libraries of the Entity-Relationship Diagram (ERD) solution for ConceptDraw DIAGRAM software.
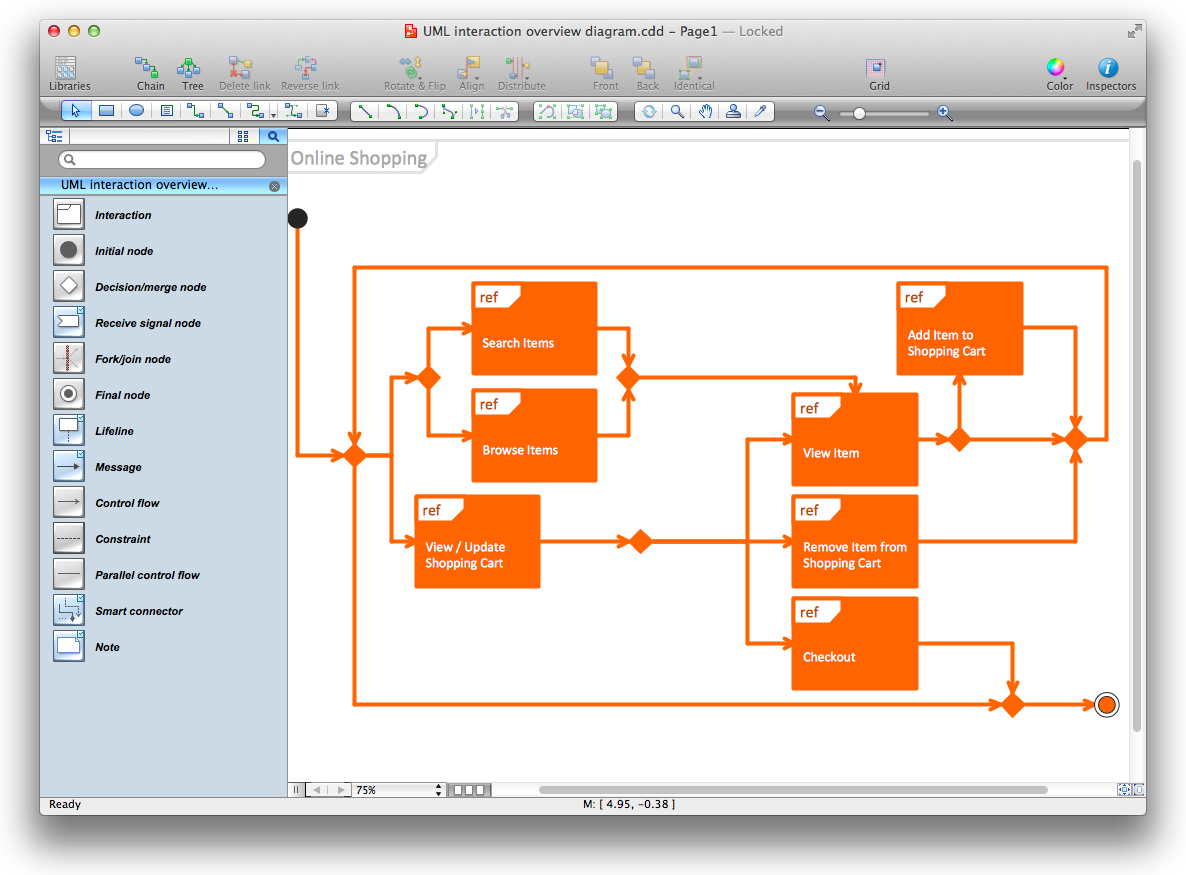
Diagramming Software for Design UML Interaction Overview Diagrams
UML Interaction Overview Diagram schematically shows a control flow with nodes and a sequence of activities that can contain interaction or sequence diagrams.
Metropolitan area networks (MAN). Computer and Network Examples
A Metropolitan Area Network (MAN) is a great computer network located on the large geographical area or region. It is a network bigger than Local Area Network (LAN), but territorially smaller than Wide Area Network (WAN), its diameter usually ranges from 5 to 50 kilometers. MAN usually includes several buildings or even the whole city (metropolis). It is based on high data rate compounds using the fiber channels and other digital data transmission channels. MAN includes a lot of communicating devices, for its construction are used multiple routers, switches and hubs. MAN can combine together several Local Area Networks or Campus Area Networks located in different buildings within a city and provides the Internet connectivity for them. Solutions included to Computer and Networks Area for ConceptDraw Solution Park are the real godsend for those who want design Computer Network Diagrams, and among others the Metropolitan Area Network Diagrams. They offer the libraries with ready-to-use vector design elements, professional-looking examples, samples and templates.
Types of Flowcharts
A Flowchart is a graphical representation of process, algorithm, workflow or step-by-step solution of the problem. It shows the steps as boxes of various kinds and connects them by arrows in a defined order depicting a flow. There are twelve main Flowchart types: Basic Flowchart, Business Process Modeling Diagram (BPMN), Cross Functional Flowchart, Data Flow Diagram (DFD), IDEF (Integrated DEFinition) Flowchart, Event-driven Process Chain (EPC) Diagram, Influence Diagram (ID), Swimlane Flowchart, Process Flow Diagram (PFD), Specification and Description Language (SDL) Diagram, Value Stream Mapping, Workflow Diagram. Using the Flowcharts solution from the Diagrams area of ConceptDraw Solution Park you can easy and quickly design a Flowchart of any of these types. This solution offers a lot of special predesigned vector symbols for each of these widely used notations. They will make the drawing process of Flowcharts much easier than ever. Pay also attention for the included collection of ready Flowchart examples, samples and quick-start templates. This is business process improvement tools. If you are looking for MS Visio for your Mac, then you are out of luck, because it hasn't been released yet. However, you can use Visio alternatives that can successfully replace its functions. ConceptDraw DIAGRAM is an alternative to MS Visio for Mac that provides powerful features and intuitive user interface for the same.
Electrical Schematics
ConceptDraw DIAGRAM diagramming and vector drawing software extended with Electrical Engineering Solution from the Industrial Engineering Area of ConceptDraw Solution Park affords you the easiest and fastest way for designing professional looking Electrical Schematics.- 
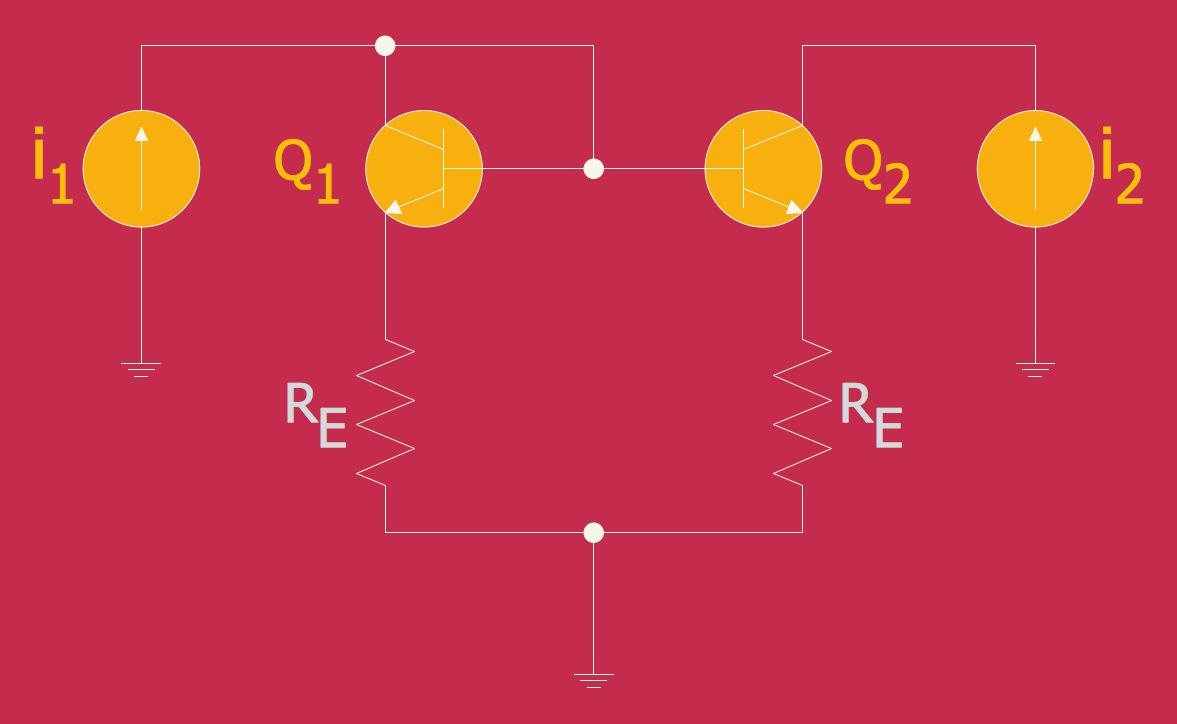
Electrical Symbols, Electrical Diagram Symbols | Wiring Diagrams ...
- Cafe electrical floor plan | Design elements - Qualifying | Design ...
- Cable Layout Diagram Sample
- Spatial infographics Design Elements : Location Map | Electrical ...
- Design elements - Logic gate diagram | Design elements - Logic ...
- Draw Block Digram Of Element Of Computer
- Local area network (LAN). Computer and Network Examples ...
- Electrician Wiring Video Download
- Design Element : Computer and Network for Network Diagrams ...
- Cable Tv Block Diagram
