Types of Flowcharts


Electrical Symbols — Power Sources

Half Pipe Plans

Geo Map — USA — Illinois

Electrical Symbols — Stations

"Consumption of energy resources, (e.g. turning on a light) requires resources and has an effect on the environment. Many electric power plants burn coal, oil or natural gas in order to generate electricity for energy needs. While burning these fossil fuels produces a readily available and instantaneous supply of electricity, it also generates air pollutants including carbon dioxide (CO2), sulfur dioxide and trioxide (SOx) and nitrogen oxides (NOx). Carbon dioxide is an important greenhouse gas which is thought to be responsible for some fraction of the rapid increase in global warming seen especially in the temperature records in the 20th century, as compared with tens of thousands of years worth of temperature records which can be read from ice cores taken in Arctic regions. Burning fossil fuels for electricity generation also releases trace metals such as beryllium, cadmium, chromium, copper, manganese, mercury, nickel, and silver into the environment, which also act as pollutants.
The large-scale use of renewable energy technologies would "greatly mitigate or eliminate a wide range of environmental and human health impacts of energy use". Renewable energy technologies include biofuels, solar heating and cooling, hydroelectric power, solar power, and wind power. Energy conservation and the efficient use of energy would also help." [Energy industry. Environmental impact. Wikipedia]
The Energy resources diagram example was created in the ConceptDraw PRO diagramming and vector drawing software using the Manufacturing and Maintenance solution from the Illustration area of ConceptDraw Solution Park.
Infographics

 Manufacturing and Maintenance
Manufacturing and maintenance solution extends ConceptDraw DIAGRAM software with illustration samples, templates and vector stencils libraries with clip art of packaging systems, industrial vehicles, tools, resources and energy.
The vector stencils library "Resources and energy" contains 19 clipart images for drawing illustrations on resources and energy.
"Natural resources occur naturally within environments that exist relatively undisturbed by humanity, in a natural form. A natural resource is often characterized by amounts of biodiversity and geodiversity existent in various ecosystems.
Natural resources are derived from the environment. Some of them are essential for our survival while most are used for satisfying our wants. Natural resources may be further classified in different ways.
Natural resources are materials and components (something that can be used) that can be found within the environment. Every man-made product is composed of natural resources (at its fundamental level). A natural resource may exist as a separate entity such as fresh water, and air, as well as a living organism such as a fish, or it may exist in an alternate form which must be processed to obtain the resource such as metal ores, oil, and most forms of energy." [Natural resource. Wikipedia]
The clip art example "Resources and energy - Vector stencils library" was created in ConceptDraw PRO diagramming and vector drawing software using the Manufacturing and Maintenance solution from the Illustration area of ConceptDraw Solution Park.
Human resources

Batteries

Wind turbine

Transmission tower

Natural gas burner

Solar panel

Lightning

Ionizing radiation hazard sign

High voltage symbol

Atom

Incandescent light bulb

Oil barrels

Power station

Wood

Perpetuum mobile

Hydroelectric dam

Liquefied petroleum gas

Natural gas

Minecart with coal

Calculate the cost of creating or updating a wireless computer network

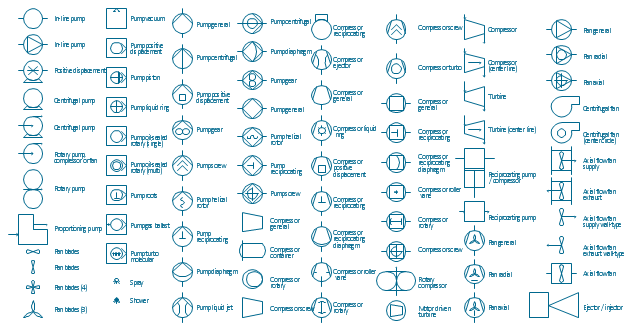
The vector stencils library "Pumps" contains 82 symbols of pumps, compressors, fans, turbines, and power generators.
Use these icons to design pumping systems, air and fluid compression systems, and industrial process diagrams.
"A pump is a device that moves fluids (liquids or gases), or sometimes slurries, by mechanical action. Pumps can be classified into three major groups according to the method they use to move the fluid: direct lift, displacement, and gravity pumps.
Pumps operate by some mechanism (typically reciprocating or rotary), and consume energy to perform mechanical work by moving the fluid. Pumps operate via many energy sources, including manual operation, electricity, engines, or wind power, come in many sizes, from microscopic for use in medical applications to large industrial pumps.
Mechanical pumps serve in a wide range of applications such as pumping water from wells, aquarium filtering, pond filtering and aeration, in the car industry for water-cooling and fuel injection, in the energy industry for pumping oil and natural gas or for operating cooling towers. In the medical industry, pumps are used for biochemical processes in developing and manufacturing medicine, and as artificial replacements for body parts, in particular the artificial heart and penile prosthesis.
In biology, many different types of chemical and bio-mechanical pumps have evolved, and biomimicry is sometimes used in developing new types of mechanical pumps." [Pump. Wikipedia]
The example "Design elements - Pumps" was created using the ConceptDraw PRO diagramming and vector drawing software extended with the Chemical and Process Engineering solution from the Engineering area of ConceptDraw Solution Park.
Pump symbols
Baseball — Pitching and the Strike Zone

 ConceptDraw Solution Park
ConceptDraw Solution Park collects graphic extensions, examples and learning materials
"Consumption of energy resources, (e.g. turning on a light) requires resources and has an effect on the environment. Many electric power plants burn coal, oil or natural gas in order to generate electricity for energy needs. While burning these fossil fuels produces a readily available and instantaneous supply of electricity, it also generates air pollutants including carbon dioxide (CO2), sulfur dioxide and trioxide (SOx) and nitrogen oxides (NOx). Carbon dioxide is an important greenhouse gas which is thought to be responsible for some fraction of the rapid increase in global warming seen especially in the temperature records in the 20th century, as compared with tens of thousands of years worth of temperature records which can be read from ice cores taken in Arctic regions. Burning fossil fuels for electricity generation also releases trace metals such as beryllium, cadmium, chromium, copper, manganese, mercury, nickel, and silver into the environment, which also act as pollutants.
The large-scale use of renewable energy technologies would "greatly mitigate or eliminate a wide range of environmental and human health impacts of energy use". Renewable energy technologies include biofuels, solar heating and cooling, hydroelectric power, solar power, and wind power. Energy conservation and the efficient use of energy would also help." [Energy industry. Environmental impact. Wikipedia]
The Energy resources diagram example was created in the ConceptDraw PRO diagramming and vector drawing software using the Manufacturing and Maintenance solution from the Illustration area of ConceptDraw Solution Park.
The large-scale use of renewable energy technologies would "greatly mitigate or eliminate a wide range of environmental and human health impacts of energy use". Renewable energy technologies include biofuels, solar heating and cooling, hydroelectric power, solar power, and wind power. Energy conservation and the efficient use of energy would also help." [Energy industry. Environmental impact. Wikipedia]
The Energy resources diagram example was created in the ConceptDraw PRO diagramming and vector drawing software using the Manufacturing and Maintenance solution from the Illustration area of ConceptDraw Solution Park.
Infographics
Electrical Diagram Software


The vector stencils library "Resources and energy" contains 19 clipart images for drawing illustrations on resources and energy.
"Natural resources occur naturally within environments that exist relatively undisturbed by humanity, in a natural form. A natural resource is often characterized by amounts of biodiversity and geodiversity existent in various ecosystems.
Natural resources are derived from the environment. Some of them are essential for our survival while most are used for satisfying our wants. Natural resources may be further classified in different ways.
Natural resources are materials and components (something that can be used) that can be found within the environment. Every man-made product is composed of natural resources (at its fundamental level). A natural resource may exist as a separate entity such as fresh water, and air, as well as a living organism such as a fish, or it may exist in an alternate form which must be processed to obtain the resource such as metal ores, oil, and most forms of energy." [Natural resource. Wikipedia]
The clip art example "Resources and energy - Vector stencils library" was created in ConceptDraw PRO diagramming and vector drawing software using the Manufacturing and Maintenance solution from the Illustration area of ConceptDraw Solution Park.
"Natural resources occur naturally within environments that exist relatively undisturbed by humanity, in a natural form. A natural resource is often characterized by amounts of biodiversity and geodiversity existent in various ecosystems.
Natural resources are derived from the environment. Some of them are essential for our survival while most are used for satisfying our wants. Natural resources may be further classified in different ways.
Natural resources are materials and components (something that can be used) that can be found within the environment. Every man-made product is composed of natural resources (at its fundamental level). A natural resource may exist as a separate entity such as fresh water, and air, as well as a living organism such as a fish, or it may exist in an alternate form which must be processed to obtain the resource such as metal ores, oil, and most forms of energy." [Natural resource. Wikipedia]
The clip art example "Resources and energy - Vector stencils library" was created in ConceptDraw PRO diagramming and vector drawing software using the Manufacturing and Maintenance solution from the Illustration area of ConceptDraw Solution Park.
Human resources
Batteries
Wind turbine
Transmission tower
Natural gas burner
Solar panel
Lightning
Ionizing radiation hazard sign
High voltage symbol
Atom
Incandescent light bulb
Oil barrels
Power station
Wood
Perpetuum mobile
Hydroelectric dam
Liquefied petroleum gas
Natural gas
Minecart with coal
Wireless Networking for Mac

Chemical Engineering

Electrical Symbols — Electron Tubes

 Pie Charts
Pie Charts are extensively used in statistics and business for explaining data and work results, in mass media for comparison (i.e. to visualize the percentage for the parts of one total), and in many other fields. The Pie Charts solution for ConceptDraw DIAGRAM offers powerful drawing tools, varied templates, samples, and a library of vector stencils for simple construction and design of Pie Charts, Donut Chart, and Pie Graph Worksheets.
- Types of Flowcharts | A Detailed Flow Diagram Showing Wind Energy
- Types of Flowcharts | Arrow Diagram For The Wind Energy
- Electrical Symbols — Power Sources | Types of Flowcharts | Flow ...
- Electrical Symbols — Power Sources | Free Visio Stencils Wind Power
- Flow chart Example. Warehouse Flowchart | Electrical Symbols ...
- Types of Flowcharts | Wind Power Pfd Drawing - Conceptdraw.com
- Weather | Types of Flowcharts | Wind Energy Flow
- Thermo | Electrical Symbols — Stations | Flow chart Example ...
- Manufacturing and Maintenance | Wind Energy Machine Flow Chart
- Electrical Symbols — Power Sources | Types of Flowcharts ...