 ConceptDraw Solution Park
ConceptDraw Solution Park collects graphic extensions, examples and learning materials
This arrows bar chart example was drawn on the base of the infographics "Inside America's Economic Machine" from the website of the United States Census Bureau.
[census.gov/ how/ img/ Econ_ Infographic.jpg]
"The Advance Report on Durable Goods Manufacturer's Shipments, Inventories and Orders, or the Durable Goods Report, provides data on new orders received from more than 4,000 manufacturers of durable goods, which are generally defined as higher-priced capital goods orders with a useful life of three years or more, such as cars, semiconductor equipment and turbines.More than 85 industries are represented in the sample, which covers the entire United States." [Economic Indicators: Durable Goods Report. R. Barnes. investopedia.com/ university/ releases/ durablegoods.asp]
The arrow graph example "Total value of manufacturers' shipments" was created using the ConceptDraw PRO diagramming and vector drawing software extended with the Picture Graphs solution from the Graphs and Charts area of ConceptDraw Solution Park.
Arrows bar chart
 Bar Graphs
The Bar Graphs solution enhances ConceptDraw PRO v10 functionality with templates, numerous professional-looking samples, and a library of vector stencils for drawing different types of Bar Graphs, such as Simple Bar Graph, Double Bar Graph, Divided Bar Graph, Horizontal Bar Graph, Vertical Bar Graph, and Column Bar Chart.
 Line Graphs
How to draw a Line Graph with ease? The Line Graphs solution extends the capabilities of ConceptDraw PRO v10 with professionally designed templates, samples, and a library of vector stencils for drawing perfect Line Graphs.
 Picture Graphs
Typically, a Picture Graph has very broad usage. They many times used successfully in marketing, management, and manufacturing. The Picture Graphs Solution extends the capabilities of ConceptDraw PRO v10 with templates, samples, and a library of professionally developed vector stencils for designing Picture Graphs.
 Website Wireframe
Create website wireframes with ConceptDraw. Wireframing tools to help with interface design. Produce wireframe examples.
 AWS Architecture Diagrams
The flexible AWS cloud solutions will help you to create reliable applications with a high level of scaling in the AWS cloud, to run your applications and accelerate their work on the level of security. Besides AWS resources are available worldwide and yo
This double bar chart example was drawn on the base of picture "Nitrate Concentration (milligrams per liter; mg/ L) in Community Water Systems (CWS), Mean and Maximum by Year, New Mexico 1999-2012" from the New Mexico's Indicator-Based Information System (NM-IBIS) website.
"Nitrate toxicity is a preventable cause of methemoglobinemia (blue baby syndrome), especially in infants. Infants younger than 4 months of age are at greatest risk of toxicity from nitrate-contaminated drinking water.
These infants are more susceptible to developing methemoglobinemia because the pH of their gut is normally higher (less acidic) than in older children and adults. The higher pH enhances the conversion of ingested nitrate to the more toxic nitrite. The bacterial flora of a young infant's gut is also different from that found in older children and adults and might be more likely to convert ingested nitrate to nitrite. Gastroenteritis can increase body transformation of nitrate to nitrite and absorption into the bloodstream of nitrite from the large intestine.
A large proportion of hemoglobin in young infants is in the form of fetal hemoglobin. Fetal hemoglobin is more readily oxidized to methemoglobin (MHg) by nitrites than is adult hemoglobin. In addition, in infants, the enzyme (NADH-dependent methemoglobin reductase) responsible for reduction of formed MHg back to normal hemoglobin has only about half the activity it has in adults.
Symptoms such as shortness of breath and bluish skin coloring around the mouth, hands, or feet, can occur in infants rapidly over a period of days. If the condition is severe, it could lead to convulsions, coma, and even death, if untreated. Most older children and adults can take in larger amounts of nitrate without experiencing the same health effects as infants. However, pregnant women, nursing mothers, and people with low stomach acid conditions or those deficient in an enzyme that changes MHg back to normal hemoglobin are more susceptible to nitrate-induced methemoglobinemia and could be affected by water with nitrate levels above 10 mg/ L.
Adverse reproductive outcomes such as spontaneous abortions, intrauterine growth retardation, and various birth defects such as anencephaly have been reported in scientific literature from exposure to high nitrate levels in drinking water; however, the evidence is inconsistent.
Little is known about possible health effects from high nitrate level exposure over a long period of time. However, some studies suggest that there might be a risk of stomach, esophageal or bladder cancers in people with prolonged ingestion of high levels of nitrate. This might be due to the formation of nitrosoamines in the body following ingestion exposure to high levels of nitrate.
International Agency for Research on Cancer (IARC) classified ingested nitrate or nitrite as probably carcinogenic to humans (Group 2A) under conditions that result in formation of nitroso-compounds (e.g., nitrosoamines) in the body (endogenous nitrosation)." [ibis.health.state.nm.us/ indicator/ view/ CommWaterNitrates.MeanMax.Year.html]
The double bar graph example "Nitrate concentration in Community Water Systems (CWS)" was created using the ConceptDraw PRO diagramming and vector drawing software extended with the Bar Graphs solution from the Graphs and Charts area of ConceptDraw Solution Park.
Double bar graph
---double-bar-chart.png--diagram-flowchart-example.png)
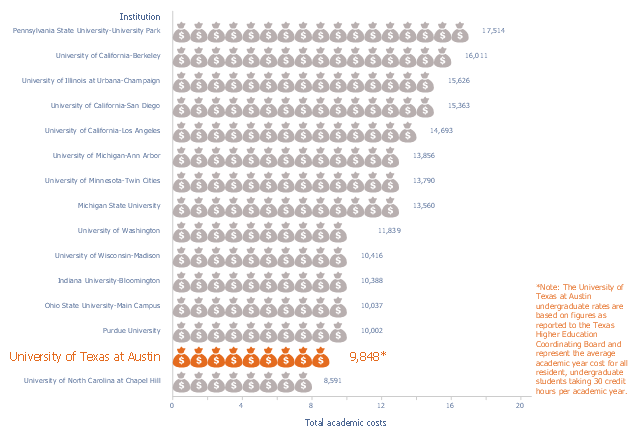
This image chart sample was drawn on the base of data from the website of the Office of Information Management and Analysis of the University of Texas at Austin.
"Undergraduate tuition and fees are based on 30 credit hours enrolled per academic year or full-time tuition as defined by the institution."
[utexas.edu/ tuition/ attach/ 2013-14_ NCG_ Tuition_ and_ Fees_ Table_ 20131122.pdf]
"Tuition payments, known primarily as tuition in American English and as tuition fees in British English, Canadian English, Australian English, New Zealand English and Indian English, refers to a fee charged for educational instruction during higher education.
Tuition payments are charged by educational institutions in some countries to assist with funding of staff and faculty, course offerings, lab equipment, computer systems, libraries, facility upkeep and to provide a comfortable student learning experience. In most countries, especially in non-English-speaking countries, there are no or only nominal tuition fees for all forms of education, including university and other higher education." [Tuition payments. Wikipedia]
The picture graph example "Resident undergraduate tuition and fees at national comparison group institutions, academic year 2013-14" was created using the ConceptDraw PRO diagramming and vector drawing software extended with the Picture Graphs solution from the Graphs and Charts area of ConceptDraw Solution Park.
Pictorial chart
Basic Diagramming Flowchart Software

 Site Plans
Vivid and enticing plan is the starting point in landscape design and site plan design, it reflects the main design idea and gives instantly a vision of the end result after implementation of this plan. Moreover site plan, architectural plan, detailed engineering documents and landscape sketches are obligatory when designing large projects of single and multi-floor buildings.
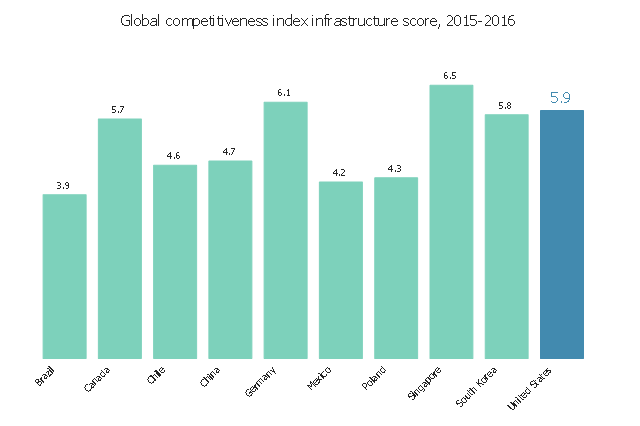
The example bar graph "Global competitiveness index infrastructure score chart, 2012-2013" was redesigned from the website "Assess Costs Everywhere" of the United States Department of Commerce. [acetool.commerce.gov/ shipping]
"The Global Competitiveness Report (GCR) is a yearly report published by the World Economic Forum. Since 2004, the Global Competitiveness Report ranks countries based on the Global Competitiveness Index, developed by Xavier Sala-i-Martin and Elsa V. Artadi. Before that, the macroeconomic ranks were based on Jeffrey Sachs's Growth Development Index and the microeconomic ranks were based on Michael Porter's Business Competitiveness Index. The Global Competitiveness Index integrates the macroeconomic and the micro/ business aspects of competitiveness into a single index." [Global Competitiveness Report. Wikipedia]
The example "Global competitiveness index infrastructure score chart, 2012-2013" was created using the ConceptDraw PRO diagramming and vector drawing software extended with the Bar Graphs solution from the Graphs and Charts area of ConceptDraw Solution Park.
www.conceptdraw.com/ solution-park/ charts-bar-graphs
Horizontal Bar Graph
- Business and Finance | Picture Graphs | Aerospace and Transport ...
- ConceptDraw Solution Park | Picture Graphs | Germany Map ...
- ConceptDraw Solution Park | Germany Map | Picture Graphs ...
- Picture Graphs | ConceptDraw Solution Park | Total Quality ...
- Website Wireframe | Best Concept For Advertisements Charts
- Picture Graphs | How to Create a Picture Graph in ConceptDraw ...
- Composition Dashboard | Pie Charts | Basic Diagramming | Drawing ...
- Picture Graphs | Network Architecture | AWS Architecture Diagrams ...
- Picture Graphs | Aerospace and Transport | ConceptDraw Solution ...
- Page load time - Frequency histogram | Histogram Chart | Make a ...
- Barrie population - Picture bar graph | Design elements - Picture ...
- Bar Graphs | Divided Bar Diagrams | ConceptDraw Solution Park ...
- Picture graphs - Vector stencils library | Total value of manufacturers ...
- How to Draw a Histogram in ConceptDraw PRO | How Do You Make ...
- Picture Graphs | ConceptDraw Solution Park | Graphs and Charts ...
- Bar Graphs | Double bar graph - Template | Nitrate concentration in ...
- Example A Picture Graph
- Picture Graph
- How to Draw a Line Graph | Line Graph | Picture Graphs | Images Of ...
- Barrie population - Picture bar graph | Picture graphs - Vector ...