This site uses cookies. By continuing to browse the ConceptDraw site you are agreeing to our Use of Site Cookies.

wireframe tools, wireframing, wire frame, website wireframe, interface design, wireframe examples Website Wireframe

wireframe tools, wireframing, wire frame, website wireframe, interface design, wireframe examples
The innovative Website Wireframe solution enhances the ConceptDraw DIAGRAM functionality with newest wireframe tools, libraries with variety of predesigned icons, symbols, buttons, graphics, forms, boxes, and many other vector elements, templates and professionally designed samples, which make it the best wireframing software. Website Wireframe solution gives you significant advantages when designing and maintaining websites, creating skeletal and content-free depictions of website structure, making website prototypes and planning the content arrangement before committing to design, also speeds up the processes of sketching, producing and sharing wireframe examples of website style and interface design.

Entity Relationship Diagram Examples

Creating an entity-relationship (ER) model is to visually represent the structure of a business database, where data equates to entities (or objects) that are linked by defined relationships expressing dependencies and requirements. By nature it is an abstract visualization, the first step in the design process towards creating a logical and functional database.
ConceptDraw gives the ability to describe a database using the Entity-Relationship model. Entity-Relationship Diagram solution includes icons advocated by Chen's and Crow’s Foot notation that can be used when describing a database.
How to Build an Entity Relationship Diagram (ERD)

Diagramming software for Amazon Web Service diagrams, charts and schemes

Professional software: visualize general system architecture, AWS diagrams are part of architecturing tools provided with ConceptDraw Solution Park.

Diagramming software for Amazon Web Service icon set: Storage

Storage icons - Amazon AWS pro diagrams - AWS diagrams are part of architecturing tools provided with ConceptDraw Solution Park.

How To create Diagrams for Amazon Web Services architecture

Want to create Diagrams for Amazon Web Services architecture? ConceptDraw Solution Park with AWS architecture Solution will help you!

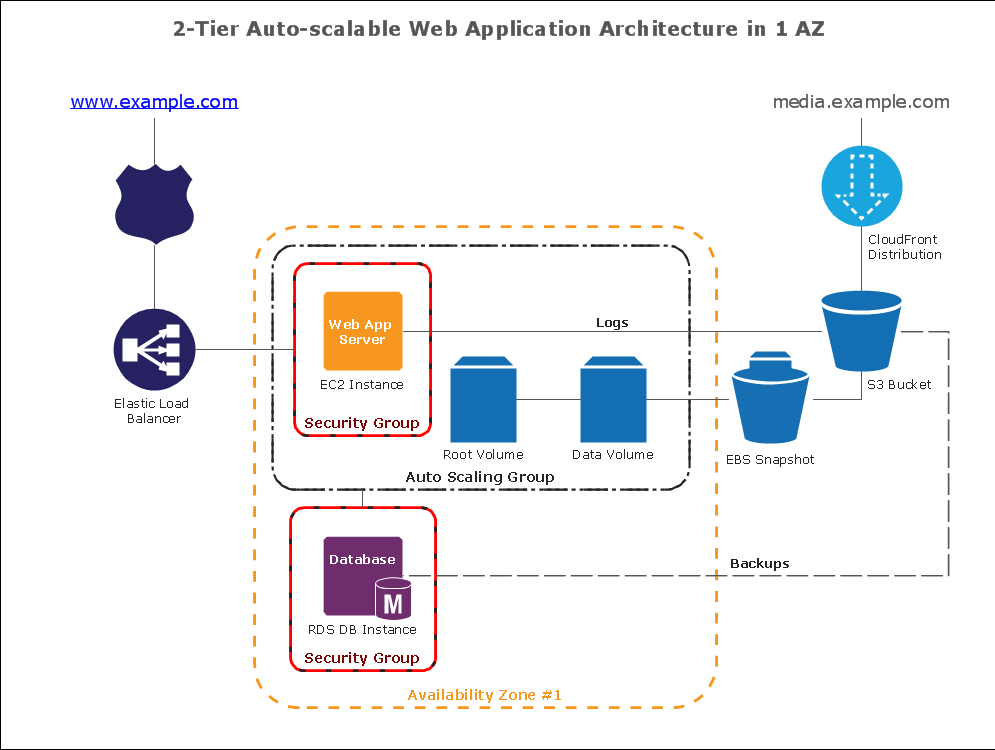
Diagramming tool - Amazon Web Services and Cloud Computing Diagrams

The AWS Architecture Diagrams solution includes icons, sample and templates for several Amazon Web Services products and resources, to be used when creating architecture diagrams. The icons are designed to be simple so that you can easily incorporate them in your diagrams and put them in your whitepapers, presentations, datasheets, posters or any technical material you like.

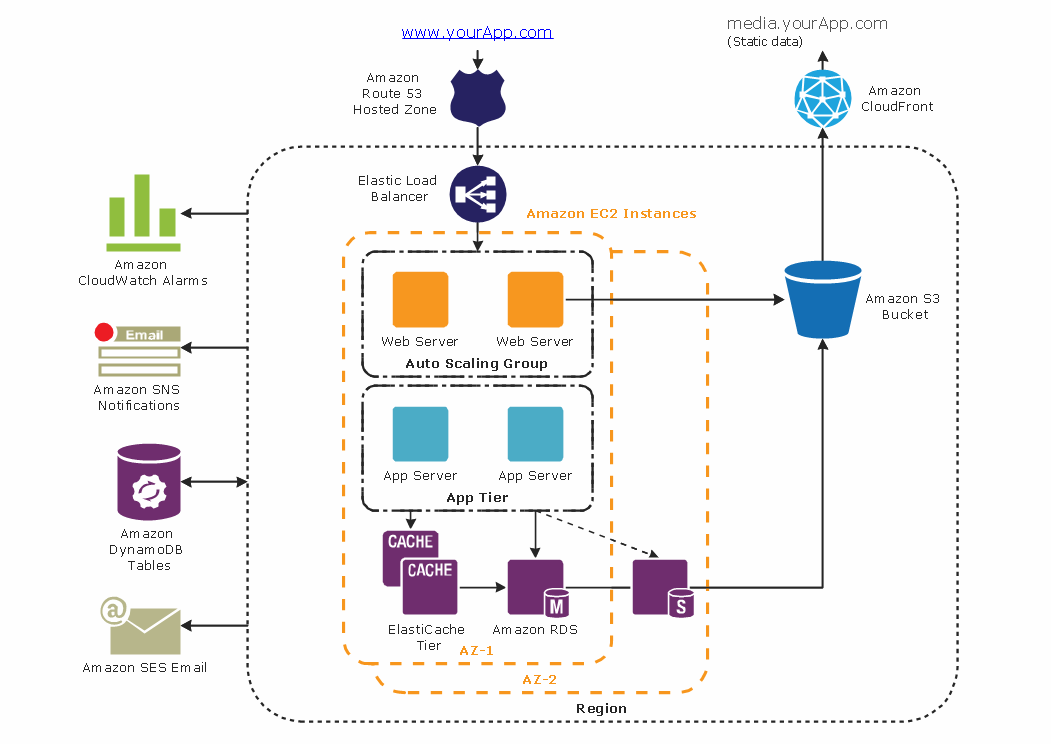
Amazon Web Services Diagrams diagramming tool for architecture

The AWS Architecture Diagrams solution includes icons, sample and templates for several Amazon Web Services products and resources, to be used when creating architecture diagrams. The icons are designed to be simple so that you can easily incorporate them in your diagrams and put them in your whitepapers, presentations, datasheets, posters or any technical material you like. Here you will find an official collection of AWS resources that will help you build great AWS Architecture diagrams.

AWS icons 2.0

Architecture diagrams solution includes the icons Amazon notation suggests to be used when creating architecture diagrams describing your use of Amazon Web Services or Amazon Cloud Services.

Used for:create Web Application Architecture, architect infrastructure based on AWS® (Amazon Web Services), design application services based on AWS® (Amazon Web Services), design auto-scalable architecture, design for elastic compute cloud, illustrate whitepapers and presentations, create vector graphics files.

Basic Flowchart Symbols and Meaning

Flowchart Symbols and Meaning - Provides a visual representation of basic flowchart symbols and their proposed use in professional workflow diagram, standard process flow diagram and communicating the structure of a well-developed web site, as well as their correlation in developing on-line instructional projects. See flowchart's symbols by specifics of process flow diagram symbols and workflow diagram symbols.
How to Build a Flowchart

Flowchart Definition

Flowchart definition - A Flowchart is a graphically representation of the structure of process or system, algorithm or the step-by-step solution of the problem. The Flowchart describes the flow of data through an information processing systems and the parts of the flows. The flow is a set of the logic operations that meet the certain requirements.