Data Visualization Solutions

Pie Chart Software

Use this donut (doughnut) chart template in the ConceptDraw PRO diagramming and vector drawing software to visualize percentage of parts of one total.
"A doughnut chart (also spelled donut) is functionally identical to a pie chart, with the exception of a blank center and the ability to support multiple statistics as one." [Pie chart. Wikipedia]
The template "Doughnut chart" is included in the Pie Charts solution of the Graphs and Charts area in ConceptDraw Solution Park.
Donut chart
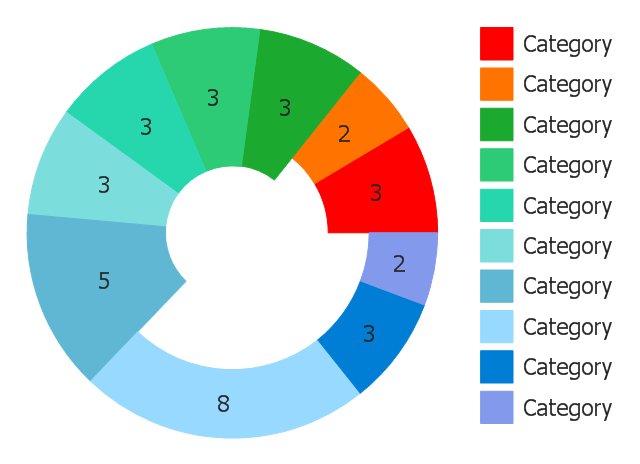
Chart Templates

The vector stencils library "Circular arrows diagrams" contains 20 templates of circular arrows diagrams, arrow donut charts and arrow circle diagrams for the ConceptDraw PRO diagramming and vector drawing software.
Circular Arrows Diagrams (Segmented Cycle Diagrams) visualize a sequence of steps, tasks, or events as a circular flow. They are used to visualize a processing cycle in marketing and management documents and presentations.
The example "Design elements - Circular arrows diagrams" is included in the Circular Arrows Diagrams solution from the area "What is a Diagram" of ConceptDraw Solution Park.
Arrow circle diagram templates
Chart Software for Better Presentations

Chart Examples

Line Chart Template for Word

Use this template of arrow circle chart (circle arrow diagram, segmented cycle diagram) in the ConceptDraw PRO diagramming and vector drawing software to visualize progression or continuing sequence of stages, tasks or events as circular flow.
The template "Arrow circle chart" is included in the Pie Charts solution of the Graphs and Charts area in ConceptDraw Solution Park.
The template "Arrow circle chart" is included in the Pie Charts solution of the Graphs and Charts area in ConceptDraw Solution Park.
Donut chart
Line Chart Examples

Chart Maker for Presentations

Workflow Diagram Template

How to Create a Pie Chart

Bar Chart Examples

Draw Company Structure with Organization Charting Software

Draw Company Structure Diagram - get the detailed information about the company structure and hierarchy - who execute what tasks and who is in charge at this company. This information shows the reasoning and success of business and is indispensable for investors and financial institutions.
- Pie Chart Software | Doughnut chart - Template | Donut chart ...
- Ring chart - Template | Arrow circle chart - Template | Chart ...
- Donut Chart Templates | Pie Chart Examples and Templates | Donut ...
- Donut Charts
- Pie Chart Examples and Templates | Pie Chart Software | Doughnut ...
- Donut Chart Templates
- Donut Chart
- Donut Chart Templates | Doughnut chart - Template | Pie Donut ...
- Arrow circle chart - Template | Pie Donut Chart. Pie Chart Examples ...
- Donut Chart With Arrows
- Doughnut chart - Template | Circular diagrams - Vector stencils ...
- Circle Charts
- Line Chart Examples | Line Graph | Pictorial Chart | Visualize Chart ...
- Pie Donut Chart. Pie Chart Examples
- Donut Graphs
- Pie Donut Chart
- Winter Sports. Illustrations and Visualize Statistics | Information ...
- Competitor Analysis | Pie Charts | Pie Donut Chart. Pie Chart ...
- Visio Donut Chart
- Pie Chart Software | Pie Chart Examples and Templates | Pie Donut ...