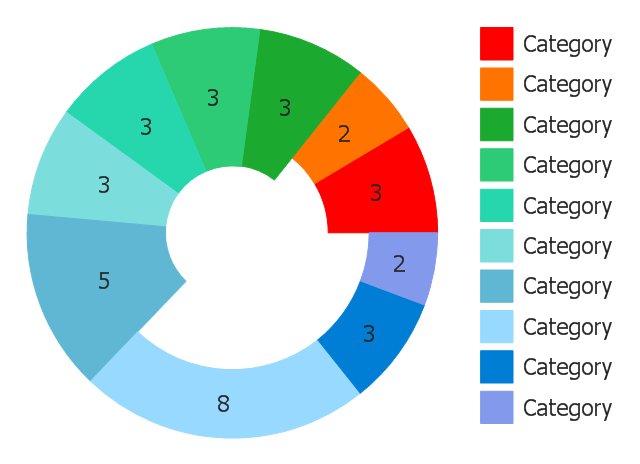
Use this donut (doughnut) chart template in the ConceptDraw PRO diagramming and vector drawing software to visualize percentage of parts of one total.
"A doughnut chart (also spelled donut) is functionally identical to a pie chart, with the exception of a blank center and the ability to support multiple statistics as one." [Pie chart. Wikipedia]
The template "Doughnut chart" is included in the Pie Charts solution of the Graphs and Charts area in ConceptDraw Solution Park.
Donut chart
Donut Chart

Donut Chart Templates

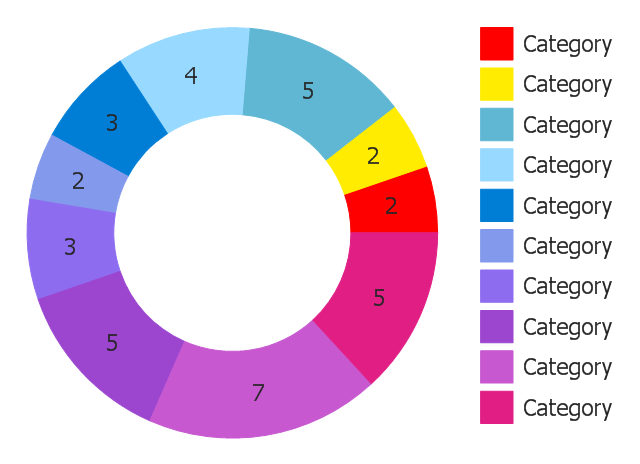
You can use this ring chart template in the ConceptDraw PRO diagramming and vector drawing software to add ring (doughnut, donut) charts to your websites, business documents, presentation slides and infographics.
"A doughnut chart (also spelled donut) is functionally identical to a pie chart, with the exception of a blank center and the ability to support multiple statistics as one." [Pie chart. Wikipedia]
The template "Ring chart" is included in the Pie Charts solution of the Graphs and Charts area in ConceptDraw Solution Park.
Donut chart
 Pie Charts
Pie Charts are extensively used in statistics and business for explaining data and work results, in mass media for comparison (i.e. to visualize the percentage for the parts of one total), and in many other fields. The Pie Charts solution for ConceptDraw DIAGRAM offers powerful drawing tools, varied templates, samples, and a library of vector stencils for simple construction and design of Pie Charts, Donut Chart, and Pie Graph Worksheets.
 Basic Pie Charts
This solution extends the capabilities of ConceptDraw DIAGRAM (or later) with templates, samples, and a library of vector stencils for drawing pie and donut charts.
Pie Chart Examples and Templates

Pie Donut Chart. Pie Chart Examples

Chart Maker for Presentations

Chart Templates

- Pie Chart Software | Doughnut chart - Template | Donut Chart ...
- Donut Chart | Pie Chart Software | Donut Chart Templates ...
- Doughnut chart - Template | Virtuous circle (management) - Ring ...
- Donut Chart Templates | Pie Chart Examples and Templates | Donut ...
- Donut Chart Templates | Quarter Sales Revenue for Top 10 ...
- Donut Chart Templates
- Doughnut chart - Template | Design elements - Pie charts | Quarter ...
- Donut Chart
- Arrow circle chart - Template | Donut chart - Template | Pie charts ...