 Active Directory Diagrams
Active Directory Diagrams solution significantly extends the capabilities of ConceptDraw DIAGRAM software with special Active Directory samples, convenient template and libraries of Active Directory vector stencils, common icons of sites and services, icons of LDPA elements, which were developed to help you in planning and modelling network structures and network topologies, in designing excellently looking Active Directory diagrams, Active Directory Structure diagrams, and Active Directory Services diagram, which are perfect way to visualize detailed structures of Microsoft Windows networks, Active Directory Domain topology, Active Directory Site topology, Organizational Units (OU), and Exchange Server organization.
MS Visio Look a Like Diagrams

HelpDesk
How To Create a CRM System Dashboard

HelpDesk
How to Use ConceptDraw Dashboard for Facebook on PC

HelpDesk
How To Create an HR Metric Dashboard

HelpDesk
How to Make a Logistic Dashboard

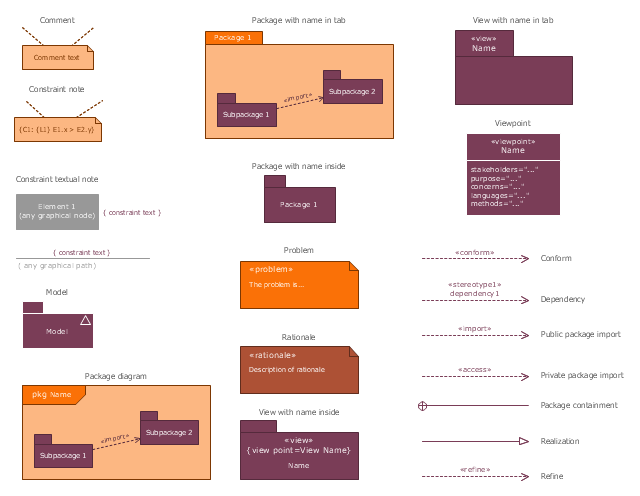
The vector stencils library "SysML diagrams" contains 19 symbols.
Use it to design your SysML diagrams using ConceptDraw PRO diagramming and vector drawing software.
"The Systems Modeling Language (SysML) is a general-purpose modeling language for systems engineering applications. It supports the specification, analysis, design, verification and validation of a broad range of systems and systems-of-systems.
SysML was originally developed by an open source specification project, and includes an open source license for distribution and use. SysML is defined as an extension of a subset of the Unified Modeling Language (UML) using UML's profile mechanism." [Systems Modeling Language. Wikipedia]
The building blocks example "Design elements - SysML diagrams" is included in the SysML solution from the Software Development area of ConceptDraw Solution Park.
SysML diagram building blocks
Playground Layouts

Visio Files and ConceptDraw

 Chen Notation
The Chen Notation solution extends ConceptDraw DIAGRAM software with rich collection of ERD samples and selection of special Chen's notation icons for effective database design, data modeling, and visual representation of relationships between the entities on the ER diagrams designed with Chen notation.
HelpDesk
How to Create a Sales Dashboard

 Android User Interface
The Android User Interface solution allows ConceptDraw DIAGRAM act as an Android UI design tool. Libraries and templates contain a variety of Android GUI elements to help users create images based on Android UI design.
ConceptDraw DIAGRAM Comparison with Omnigraffle Professional and MS Visio

How to Construct a Fishbone Diagram

 One-line Diagrams
One-line Diagrams solution is a powerful electrical engineering tool to develop precise and detailed One-line Diagram, Single-line Diagram, Electrical diagram. This solution supplies the ConceptDraw DIAGRAM users with a wide set of vector libraries with special icons and electrical symbol elements for one-line drawing and electrical engineering diagram design including. It includes a large collection of samples of One-line Diagrams illustrating high-voltage and low-voltage systems, different electrical configurations and topologies, transmission systems, application of circuit breakers, protection electrical equipment, etc. It is perfect for all power-related workers, engineers, electricians, and other professionals working in power engineering and energy industries.
 Energy Industry Infographics
Energy Industry Infographics solution is ideal for designing energy-related business infographics, diagrams, charts, illustrations for documents and presentations. It provides a set of libraries with special vector energy industry symbols, icons for electrical power industry, nuclear power industry, fossil fuel industry, and renewable energy industry, energy icons of fuel gas, liquid fuel, solid fuel, industry icons of electrical substations, power plants. Collection of samples including nuclear fuel cycle and energy distribution schematics, electrical substation diagram, energy intelligence dashboard, electricity grid schematics, and many more is also included. This solution is indispensable for all engineers, chefs, managers, marketers, and other professionals working in energy industry.
- Visio Files and ConceptDraw | Open Source Visio Equivalent
- Visio Files and ConceptDraw | Open Source Drawing Tool Like Visio
- ConceptDraw DIAGRAM Compatibility with MS Visio | Visio Files ...
- ConceptDraw DIAGRAM Compatibility with MS Visio | Visio Files ...
- Windows Azure | Open Source Visio Replacement For Windows
- Process Flowchart | Open Source Equivalent To Visio
- ConceptDraw DIAGRAM Compatibility with MS Visio | Visio Files ...
- Process Flowchart | UML Diagram Visio | Open Source Visio Editor
- Visio Files and ConceptDraw | Open Source Microsoft Visio
- ConceptDraw PRO Compatibility with MS Visio | Visio Files and ...