This site uses cookies. By continuing to browse the ConceptDraw site you are agreeing to our Use of Site Cookies.

ER Diagram Styles

When creating ER diagrams, you can apply different color ER diagram styles and also notation styles. ConceptDraw DIAGRAM enhanced with Entity-Relationship Diagram (ERD) Solution gives the ability to draw visual and attractive ER Diagrams using the style icons from Crow’s Foot notation and Chen's notation professionally designed and offered by ERD Chen's Notation and ERD Crow’s Foot Notation libraries.

Entity Relationship Diagram Symbols

The semantic modeling method nowadays is successfully applied in database structure design. It is effective method of modeling the data structures, which is based on the meaning of these data. As a tool of semantic modeling, there are used different types of Entity-Relationship Diagrams. Entity Relationship Diagram (ERD) is applied to visually and clearly represent a structure of a business database. The main components of ERDs are: entity, relation and attributes. An entity is a class of similar objects in the model, each entity is depicted in the form of rectangle and has the name expressed by a noun. Relation is shown in the form of non-directional line that connects two entities. There are several notation styles used for ERDs: information engineering style, Chen style, Bachman style, Martin Style. The Entity Relationship Diagram symbols used for professional ERD drawing are predesigned by professionals and collected in the libraries of the Entity-Relationship Diagram (ERD) solution for ConceptDraw DIAGRAM software.

Visio Files and ConceptDraw

Visio Files and ConceptDraw. ConceptDraw DIAGRAM is compatible with MS Visio.VDX formatted files.VDX is Visio’s open XML file format, and it can be easily imported and exported by ConceptDraw DIAGRAM.

Entity Relationship Diagram Examples

Creation of Entity-Relationship (ER) model is a visual representation the structure of a business database, where data equates to entities or objects, which are linked by defined relationships expressing dependencies and requirements. By the nature, the ER model is an abstract visualization, a first step in design process towards creating a logical and functional database. ConceptDraw DIAGRAM professional software gives the ability to effectively describe a database using the Entity-Relationship model. Included to ConceptDraw Solution Park, the Entity-Relationship Diagram (ERD) solution contains the set of predesigned vector icons advocated by Chen's and Crow’s Foot notations that both can be used for data modeling and describing a database. Entity-Relationship Diagram (ERD) solution includes also helpful templates and incredibly large collection of varied Entity Relationship Diagram examples and samples offered at ConceptDraw STORE. Each of them can be used to develop your own model of a database of arbitrary complexity.
How to Build an Entity Relationship Diagram (ERD)

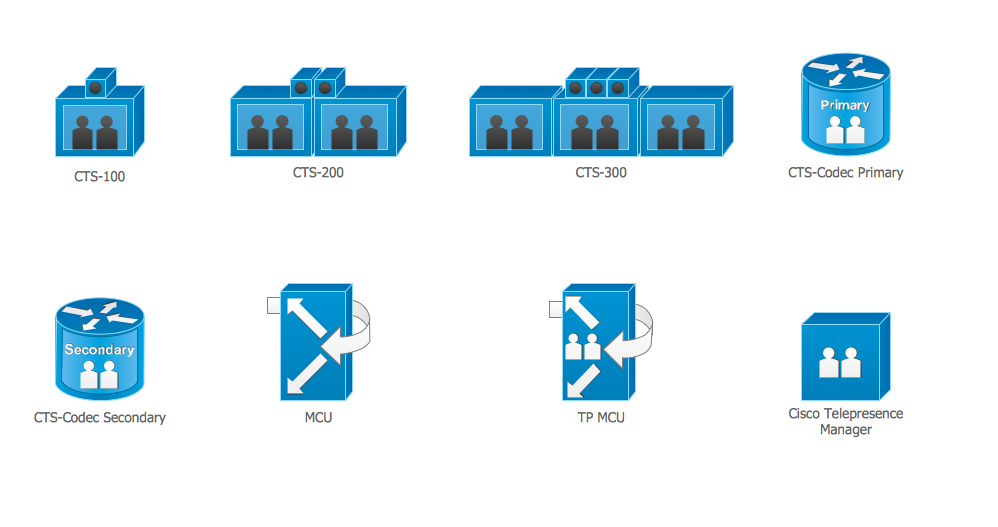
Cisco Telepresence. Cisco icons, shapes, stencils and symbols

The ConceptDraw vector stencils library Cisco Telepresence contains videoconference equipment symbols for drawing the computer network diagrams.

ERD Symbols and Meanings

Entity Relationship Diagram (ERD) is a popular software engineering tool for database modeling and illustration the logical structure of databases, which uses one of two notations - Chen's or Crow’s Foot. Crow's foot notation is effective when used in software engineering, information engineering, structured systems analysis and design. Each of these notations applies its own set of ERD symbols. Crow's foot diagrams use boxes to represent entities and lines between these boxes to show relationships. Varied shapes at the ends of lines depict the cardinality of a given relationship. Chen's ERD notation is more detailed way to represent entities and relationships. ConceptDraw DIAGRAM application enhanced with all-inclusive Entity-Relationship Diagram (ERD) solution allows design professional ER diagrams with Chen's or Crow’s Foot notation on your choice. It contains the full set of ready-to-use standardized ERD symbols and meanings helpful for quickly drawing, collection of predesigned ERD samples, examples and templates. ConceptDraw Pro is a great alternative to Visio for Mac users as it offers more features and can easily handle the most demanding professional needs.
How to Build an Entity Relationship Diagram (ERD)

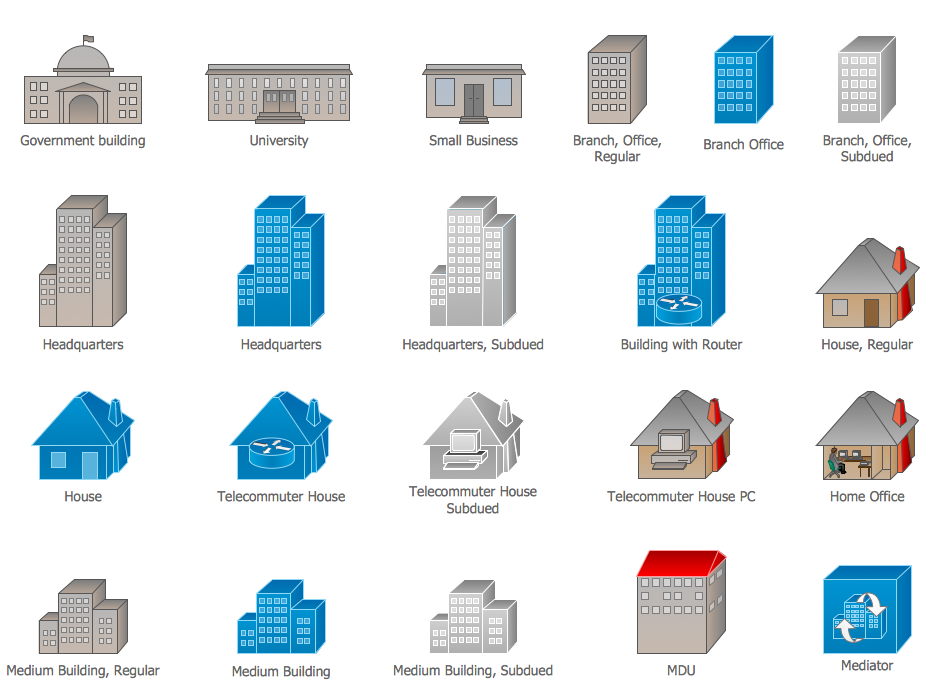
Cisco Buildings. Cisco icons, shapes, stencils and symbols

Cisco icons are globally recognized and generally accepted as standard for network icon topologies. The ConceptDraw vector stencils library "Cisco buildings" contains 21 symbols for drawing the computer network diagrams using the ConceptDraw DIAGRAM diagramming and vector drawing software.

Software Diagram Templates

Use Software Diagram Templates from the solutions of Software Development area for ConceptDraw DIAGRAM to create your own professional looking Software Diagrams in minutes. The Software Diagrams designed with ConceptDraw DIAGRAM are vector graphic documents and are available for reviewing, modifying, converting to a variety of formats (image, HTML, PDF file, MS PowerPoint Presentation, Adobe Flash or MS Visio XML), printing and send via e-mail in one moment.

Cisco Security. Cisco icons, shapes, stencils and symbols

The ConceptDraw vector stencils library "Cisco Security" contains 16 symbols of security devices and equipment for drawing the computer network diagrams using the ConceptDraw DIAGRAM diagramming and vector drawing software.

MS Visio Look a Like Diagrams

No need for any special drawing skills to create professional looking diagrams outside of your knowledge base. ConceptDraw DIAGRAM takes care of the technical details, allowing you to focus on your job, not the drawing. ConceptDraw DIAGRAM delivers full-functioned alternative to MS Visio. ConceptDraw DIAGRAM supports import of Visio files. ConceptDraw DIAGRAM supports flowcharting, swimlane, orgchart, project chart, mind map, decision tree, cause and effect, charts and graphs, and many other diagram types.