This site uses cookies. By continuing to browse the ConceptDraw site you are agreeing to our Use of Site Cookies.

3 Circle Venn Diagram. Venn Diagram Example

This template shows the Venn Diagram. It was created in ConceptDraw PRO diagramming and vector drawing software using the ready-to-use objects from the Venn Diagrams Solution from the "What is a Diagram" area of ConceptDraw Solution Park.
Venn Diagrams visualize all possible logical intersections between several sets and are widely used in mathematics, logic, statistics, marketing, sociology, etc.

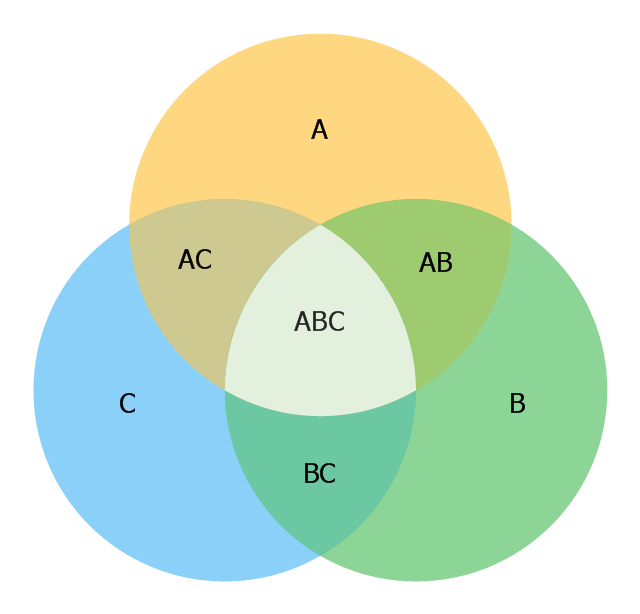
3 Circle Venn. Venn Diagram Example

This example shows the 3 Circle Venn Diagram. The Venn Diagrams visualize all possible logical intersections between several sets. On this example you can see the intersections of 3 sets. Venn Diagrams are widely used in mathematics, logic, statistics, marketing, sociology, etc.

Circle Spoke Diagram Template

ConceptDraw PRO diagramming and vector drawing software offers the Circle Spoke Diagram Template included in the Circle-Spoke Diagrams Solution from the "What is a Diagram" Area. Use of ready template is the easiest way of drawing professional looking Circle-Spoke Diagrams.

Cylinder Venn Diagram

You need design Cylinder Venn Diagram? Nothing could be easier with ConceptDraw PRO diagramming and vector drawing software extended with Venn Diagrams Solution from the “What is a Diagram” Area. ConceptDraw PRO allows you to design various Venn Diagrams including Cylinder Venn Diagrams.

Venn Diagram

Venn diagrams are illustrations used in the branch of mathematics known as set theory. They show the mathematical or logical relationship between different groups of things (sets). A Venn diagram shows all the possible logical relations between the sets.

Venn Diagram Examples for Problem Solving. Venn Diagram as a Truth Table

Venn diagrams are illustrations used in the branch of mathematics known as set theory. They show the mathematical or logical relationship between different groups of things (sets). A Venn diagram shows all the possible logical relations between the sets.

Gantt Chart Templates

Gantt Chart Templates - PM Easy Solution from the Project Management Area extends ConceptDraw PROJECT with the ability to quickly start a project. It lists task dependencies and relationships making the terative planning easy.
ConceptDraw PROJECT lets you the useful possibility to create visual project dashboards and diagrams, generate various kinds of reports with one click. It provides also extensive capabilities of importing and exporting in various formats: Microsoft Project, ConceptDraw MINDMAP, Mindjet MindManager, PDF file.

Venn Diagram Template

It's impossible to overestimate the usefulness and convenience of using the ready templates when you create your own diagrams and charts. And Venn Diagrams are not exception. ConceptDraw PRO diagramming and vector drawing software presents the Venn Diagrams solution from "What is a Diagram" area which offers a set of Venn Diagram templates and samples. Use the suitable Venn Diagram Template to create your own Venn Diagram of any complexity.
The vector stencils library "Circular diagrams" contains 42 templates of circular diagrams: circular arrow diagram, circular motion diagram, arrow ring chart, doughnut chart (donut chart), circle pie chart, diamond pie chart, circle diagram, pie chart, ring chart, loop diagram, block loop diagram, arrow loop circle, crystal diagram, triangular diagram, diamond diagram, pentagon diagram, hexagon diagram, heptagon diagram, cycle diagram (cycle chart), stacked Venn diagram (onion diagram), arrow circle diagram.
Use these shapes to illustrate your marketing and sales documents, presentations, webpages and infographics in the ConceptDraw PRO diagramming and vector drawing software extended with the Target and Circular Diagrams solution from the Marketing area of ConceptDraw Solution Park.
www.conceptdraw.com/ solution-park/ marketing-target-and-circular-diagrams
Circular arrow diagram 1
Circular arrow diagram 1, circular arrow diagram, circular motion diagram,
Circular arrow diagram 2
Circular arrow diagram 2, circular arrow diagram, circular motion diagram,
Arrow ring chart
Arrow ring chart, circular arrow diagram, circular motion diagram,
Doughnut chart
Doughnut chart, doughnut chart, pie chart, ring chart, donut chart,
Diamond pie chart
Diamond pie chart, diamond pie chart, circular diagram,
Pie chart
Pie chart, pie chart,
Circle diagram
Circle diagram, circle diagram, circular diagram,
Circle pie chart 2
Circle pie chart 2, circle pie chart, circular diagram, marketing mix diagram,
Circle pie chart 1
Circle pie chart 1, circle pie chart, circular diagram, marketing mix diagram,
Ring chart 1 - 3 elements
Ring chart 1 - 3 elements, doughnut chart, pie chart, ring chart, donut chart,
Ring chart 1 - 4 elements
Ring chart 1 - 4 elements, doughnut chart, pie chart, ring chart, donut chart,
Ring chart 1 - 5 elements
Ring chart 1 - 5 elements, doughnut chart, pie chart, ring chart, donut chart,
Ring chart 1 - 6 elements
Ring chart 1 - 6 elements, doughnut chart, pie chart, ring chart, donut chart,
Ring chart 1 - 7 elements
Ring chart 1 - 7 elements, doughnut chart, pie chart, ring chart, donut chart,
Ring chart 2 - 3 elements
Ring chart 2 - 3 elements, doughnut chart, pie chart, ring chart, donut chart,
Ring chart 2 - 4 elements
Ring chart 2 - 4 elements, doughnut chart, pie chart, ring chart, donut chart,
Ring chart 2 - 5 elements
Ring chart 2 - 5 elements, doughnut chart, pie chart, ring chart, donut chart,
Ring chart 2 - 6 elements
Ring chart 2 - 6 elements, doughnut chart, pie chart, ring chart, donut chart,
Ring chart 2 - 7 elements
Ring chart 2 - 7 elements, doughnut chart, pie chart, ring chart, donut chart,
Crystal diagram - 3 elements
Crystal diagram - 3 elements, crystal diagram, triangular diagram,
Crystal diagram - 4 elements
Crystal diagram - 4 elements, crystal diagram, diamond diagram,
Crystal diagram - 5 elements
Crystal diagram - 5 elements, crystal diagram, pentagon diagram,
Crystal diagram - 6 elements
Crystal diagram - 6 elements, crystal diagram, hexagon diagram,
Crystal diagram - 7 elements
Crystal diagram - 7 elements, crystal diagram, heptagon diagram,
Stacked Venn diagram - 4
Stacked Venn diagram - 4, stacked Venn diagram, onion diagram,
Stacked Venn diagram - 5
Stacked Venn diagram - 5, stacked Venn diagram, onion diagram,
Stacked Venn diagram - 6
Stacked Venn diagram - 6, stacked Venn diagram, onion diagram,
Stacked Venn diagram - 7
Stacked Venn diagram - 7, stacked Venn diagram, onion diagram,
Basic loop diagram
Basic loop diagram, basic loop diagram,
Block loop diagram
Block loop diagram, block loop diagram,
Arrow loop circle
Arrow loop circle, arrow loop circle,
Arrow loop - 3 circles
Arrow loop - 3 circles, arrow loop diagram,
Arrow loop - 4 circles
Arrow loop - 4 circles, arrow loop diagram,
Arrow loop - 5 circles
Arrow loop - 5 circles, arrow loop diagram,
Arrow loop - 6 circles
Arrow loop - 6 circles, arrow loop diagram,
Arrow loop - 7 circles
Arrow loop - 7 circles, arrow loop diagram,
Arrow circle diagram - 3
Arrow circle diagram - 3, arrow circle diagram,
Arrow circle diagram - 4
Arrow circle diagram - 4, arrow circle diagram,
Stacked Venn diagram - 3
Stacked Venn diagram - 3, stacked Venn diagram, onion diagram,
Arrow circle diagram - 5
Arrow circle diagram - 5, arrow circle diagram,
Arrow circle diagram - 6
Arrow circle diagram - 6, arrow circle diagram,
Arrow circle diagram - 7
Arrow circle diagram - 7, arrow circle diagram,

ConceptDraw PRO

ConceptDraw PRO is a powerful business and technical diagramming software tool that enables you to design professional-looking graphics, diagrams, flowcharts, floor plans and much more in just minutes. Maintain business processes performance with clear visual documentation. Effectively present and communicate information in a clear and concise manner with ConceptDraw PRO.

Construction Project Chart Examples

ConceptDraw PROJECT provides a set of construction Gantt chart examples. Project manager requires task tracking, and project examples best approach to start. Make your project applying one of our ready-made examples.

Circle Diagrams

The Circle Diagrams are the diagrams which represent the central element surrounded by other items in a circle. This type of diagram is very popular and widely used in marketing and management, for process modeling, market, resource, time and cost analysis, for visualization causes and effects. If you dream to design the Circle Diagrams quick and easy – the ConceptDraw PRO software extended with Circle-Spoke Diagrams Solution from the "What is a Diagram" Area is exactly what you need.

Venn Diagram Examples for Problem Solving . Quantum Information Science. BQP Complexity

Venn diagrams are illustrations used in the branch of mathematics known as set theory. They show the mathematical or logical relationship between different groups of things (sets). A Venn diagram shows all the possible logical relations between the sets.
"Definition of VENN DIAGRAM: a graph that employs closed curves and especially circles to represent logical relations between and operations on sets and the terms of propositions by the inclusion, exclusion, or intersection of the curves" [merriam-webster.com/ dictionary/ venn%20 diagram]
The 3-set Venn diagram template is included in the Venn diagrams solution from the area "What is a Diagram" of ConceptDraw Solution Park.
Venn diagram
Venn diagram, Venn diagram,

2 Circle Venn Diagram. Venn Diagram Example

Using the ready-to-use predesigned objects, samples and templates from the Venn Diagrams Solution for ConceptDraw PRO you can create your own professional looking Venn Diagrams quick and easy.