The vector stencils library "Bar charts" contains 7 templates of bar and column charts for visualizing quantitative and statistical data comparison and changes in time series. Drag template from library to your document and enter your data.
Use these shapes to draw your bar graphs in the ConceptDraw PRO diagramming and vector drawing software.
The vector stencils library "Bar charts" is included in the Bar Graphs solution from the Graphs and Charts area of ConceptDraw Solution Park.
Use these shapes to draw your bar graphs in the ConceptDraw PRO diagramming and vector drawing software.
The vector stencils library "Bar charts" is included in the Bar Graphs solution from the Graphs and Charts area of ConceptDraw Solution Park.
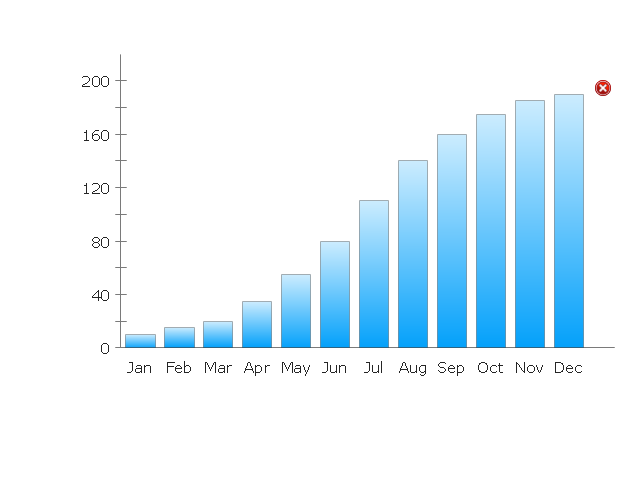
Vertical bar chart

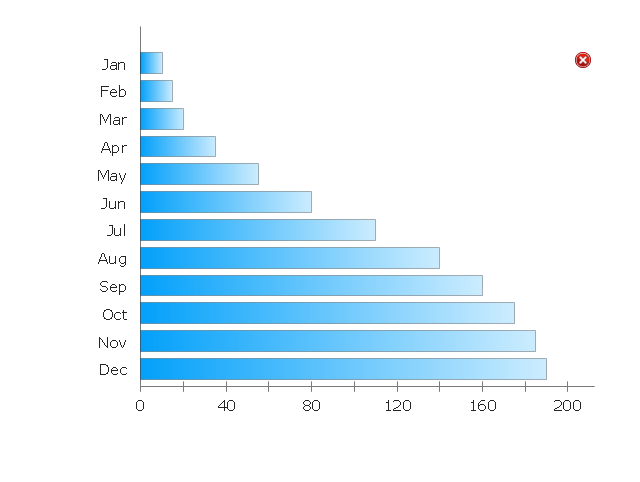
Horizontal bar chart

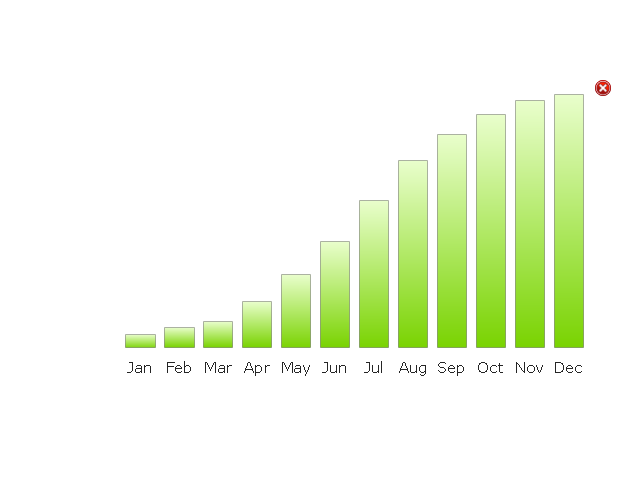
3D bar chart

Cylindrical bar chart

Double bar chart

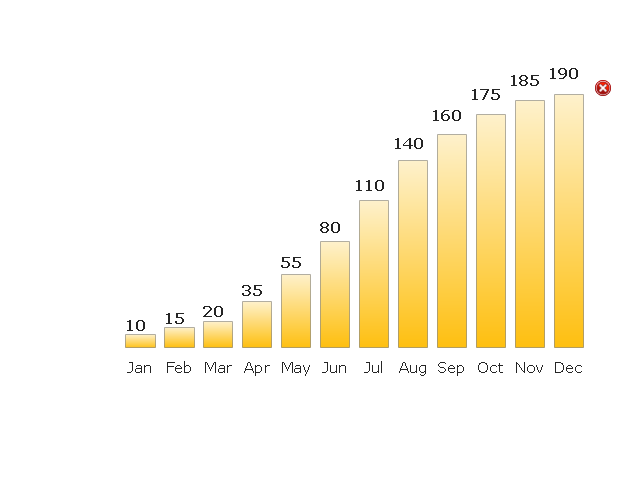
Column chart - serial

Horizontal bar chart - serial

Coordinate system 3D

Rainfall Bar Chart

Bar Chart Examples

Bar Chart Software

Bar Chart Template for Word

Bar Charts

Bar Chart

Waterfall Bar Chart

Chart Maker for Presentations

Column Chart Software

Sales Growth. Bar Graphs Example

Financial Comparison Chart

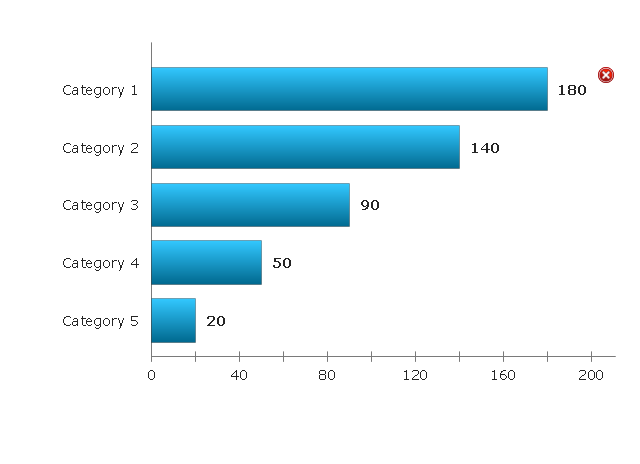
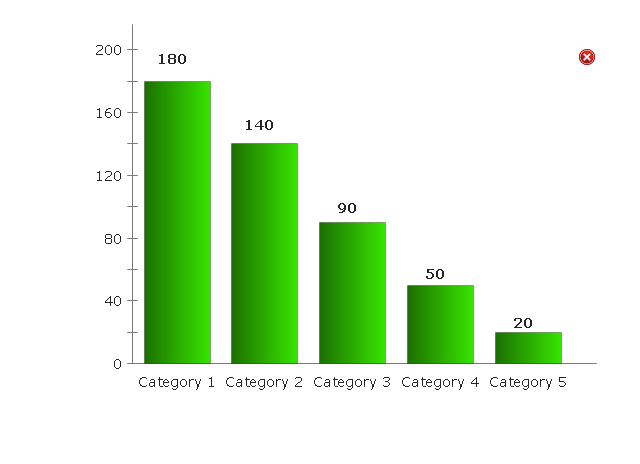
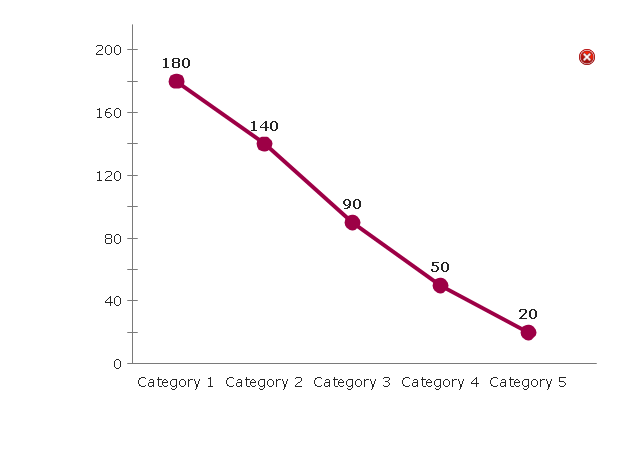
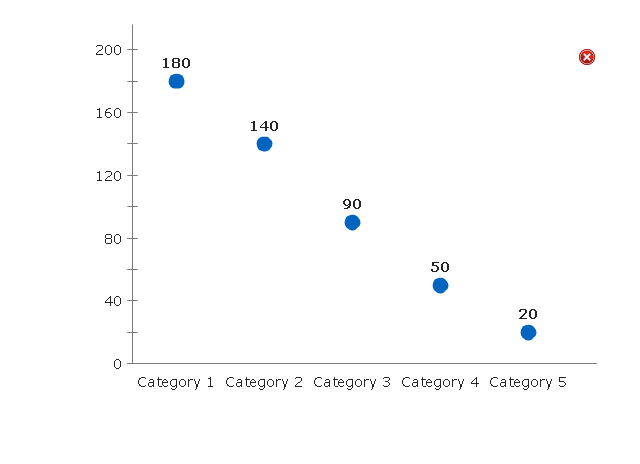
The vector stencils library "Comparison charts" contains 4 Live Objects: Horizontal bar chart template, Column chart (Vertical bar chart) template, Line chart template and Dot plot (Scatter chart) template.
Use it for drawing visual dashboards in the ConceptDraw PRO diagramming and vector drawing software extended with the Comparison Dashboard solution from the area "What is a Dashboard" of ConceptDraw Solution Park.
www.conceptdraw.com/ solution-park/ comparison-dashboard
Use it for drawing visual dashboards in the ConceptDraw PRO diagramming and vector drawing software extended with the Comparison Dashboard solution from the area "What is a Dashboard" of ConceptDraw Solution Park.
www.conceptdraw.com/ solution-park/ comparison-dashboard
Horizontal Bar Chart
Column Chart
Line Chart
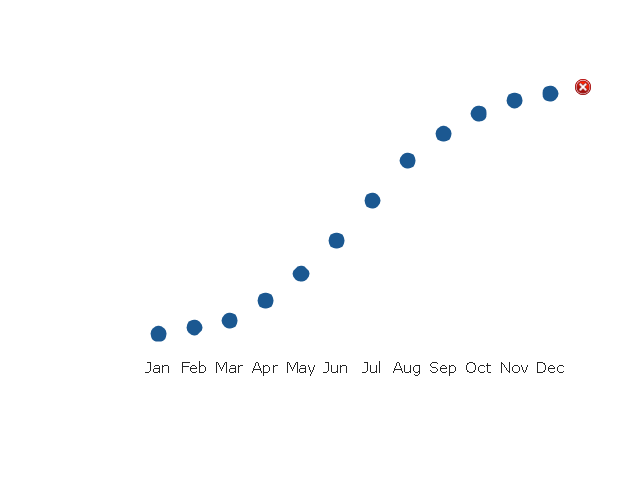
Dot Plot
Bar Diagrams for Problem Solving. Create business management bar charts with Bar Graphs Solution

The vector stencils library "Time series charts" contains 10 templates of time series charts: 3 column charts, 3 bar charts, 2 line graphs and 2 dot plots. All these time series charts are Live Objects displaying the data from external data source files.
Use this library to create your visual dashboards in the ConceptDraw PRO diagramming and vector drawing software extended with the Time Series Dashboard solution from the area "What is a Dashboard" of ConceptDraw Solution Park.
Use this library to create your visual dashboards in the ConceptDraw PRO diagramming and vector drawing software extended with the Time Series Dashboard solution from the area "What is a Dashboard" of ConceptDraw Solution Park.
Column Chart 1
Column Chart 2
Column Chart 3
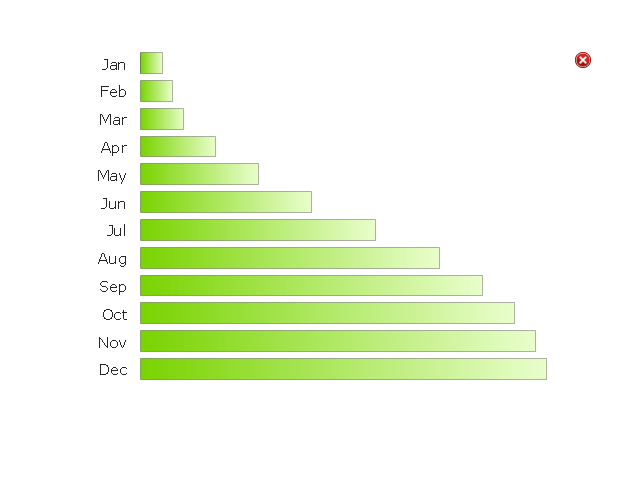
Bar Chart 1
Bar Chart 2
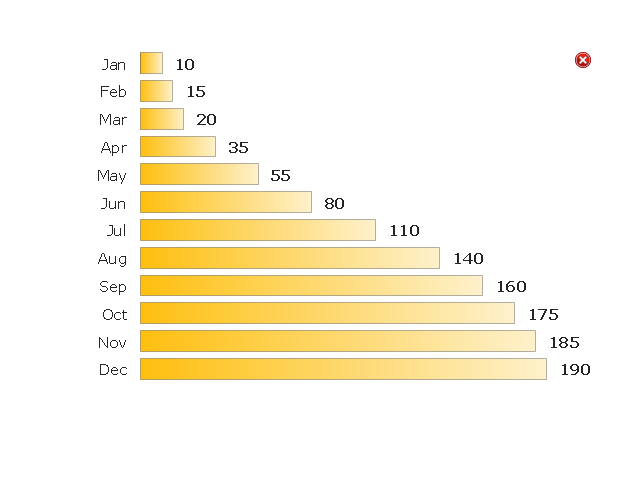
Bar Chart 3
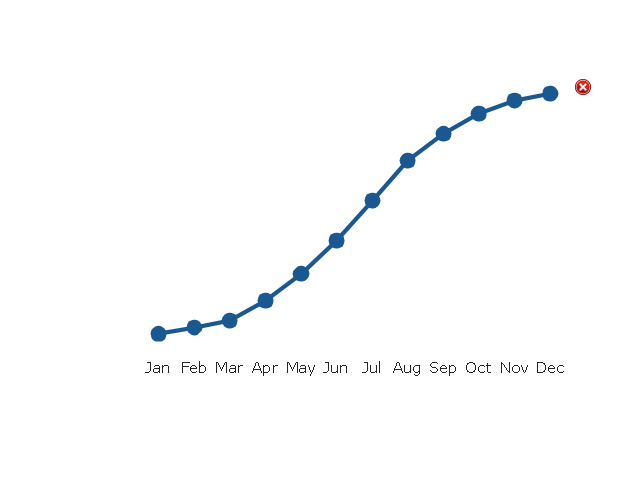
Line Chart 1
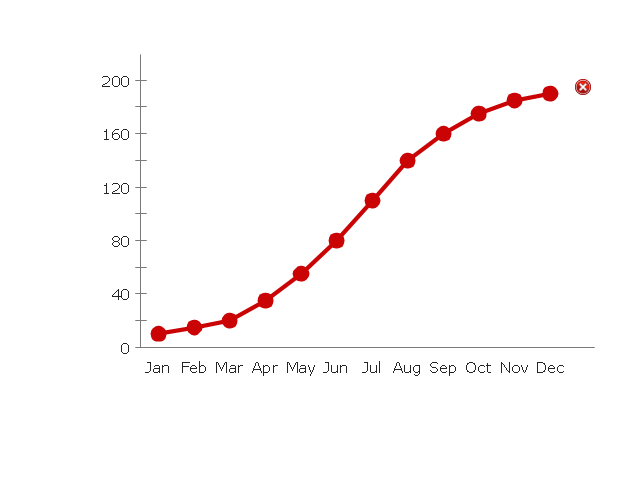
Line Chart 2
Dot Plot 1
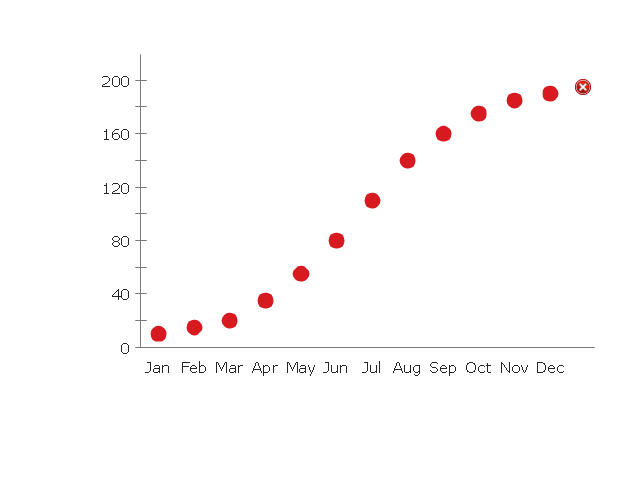
Dot Plot 2
- Area charts - Vector stencils library | Bar charts - Vector stencils ...
- Bar charts - Vector stencils library
- Bar Chart Software | Bar charts - Vector stencils library | Column ...
- Bar Chart Template for Word | Comparison charts - Vector stencils ...
- How to Create a Bar Chart in ConceptDraw PRO | Rainfall Bar Chart ...
- Time series charts - Vector stencils library | Bar Diagrams for ...
- Bar Chart Examples
- Bar Charts
- Bar Chart Software | Chart Maker for Presentations | Data-driven ...
- Trigonometric functions - Vector stencils library | Trigonometric ...
- Financial Comparison Chart | Sales Growth. Bar Graphs Example ...
- Grouped Bar Charts
- Bar Chart Template
- How to Draw a Divided Bar Chart in ConceptDraw PRO | Divided ...
- Rainfall Bar Chart | Bar Diagrams for Problem Solving. Create space ...
- Sales Growth. Bar Graphs Example | Finance - Vector stencils library ...
- Waterfall Bar Chart | Design elements - Geography | Geography ...
- Sales Growth. Bar Graphs Example | Bar Chart Examples | Bar ...
- Bar Chart Examples
- Bar Chart Examples | Rainfall Bar Chart | Sales Growth. Bar Graphs ...