"A value chain is a chain of activities that a firm operating in a specific industry performs in order to deliver a valuable product or service for the market. ...
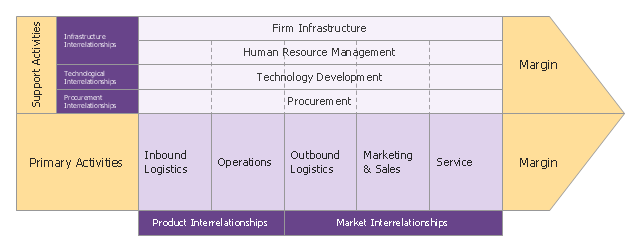
The concept of value chains as decision support tools, was added onto the competitive strategies paradigm developed by Porter as early as 1979. In Porter's value chains, Inbound Logistics, Operations, Outbound Logistics, Marketing and Sales and Service are categorized as primary activities. Secondary activities include Procurement, Human Resource management, Technological Development and Infrastructure." [Value chain. Wikipedia]
This Porter's value chain matrix diagram example was created using the ConceptDraw PRO diagramming and vector drawing software extended with the Matrices solution from the Marketing area of ConceptDraw Solution Park.
Porter's value chain matrix

Competitor Analysis

Porter's Value Chain

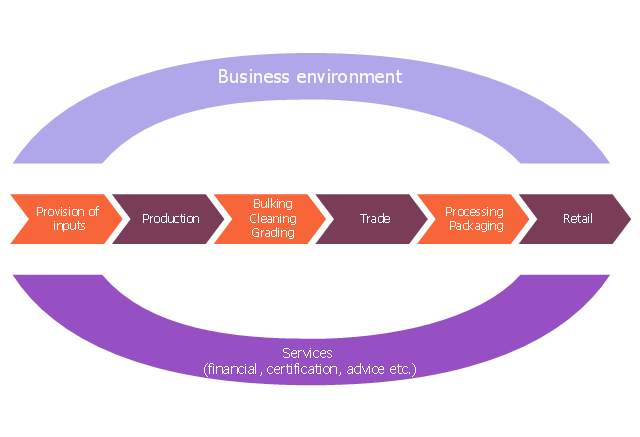
This value chain analysis diagram example illustrates value chain analysis. It was designed on the base of the Wikimedia Commons file: Typical-value-Chain.png. "Typical value chain of agricultural commodities. Belongs to The Organic Business Guide." [commons.wikimedia.org/ wiki/ File:Typical-value-Chain.png]
This file is licensed under the Creative Commons Attribution-Share Alike 3.0 Unported license. [creativecommons.org/ licenses/ by-sa/ 3.0/ deed.en]
"The agricultural value chain concept has been used since the beginning of the millennium, primarily by those working in agricultural development in developing countries. Although there is no universally accepted definition of the term, it normally refers to the whole range of goods and services necessary for an agricultural product to move from the farm to the final customer or consumer." [Agricultural value chain. Wikipedia]
The marketing chart example "Value chain analysis diagram" was created using the ConceptDraw PRO diagramming and vector drawing software extended with the Marketing Diagrams solution from the Marketing area of ConceptDraw Solution Park.
Marketing chart
Process Flowchart


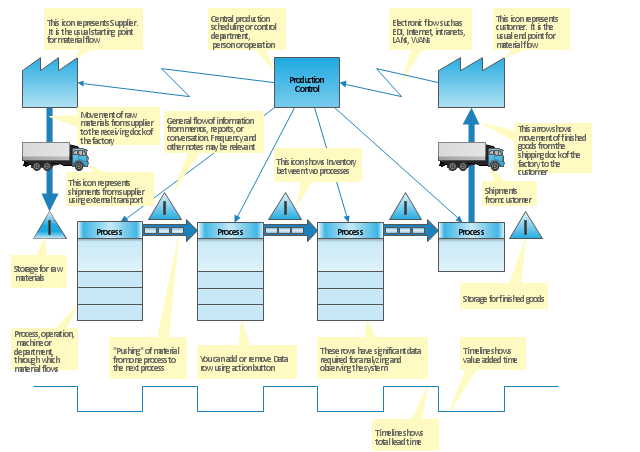
"Value stream mapping is a lean management principle used to analyze and design the flow of materials and information required to bring a product or service to a consumer. Pioneered by Henry Ford in the 1920s, perfected by Toyota. At Toyota, it is known as "material and information flow mapping". It can be applied to nearly any value chain. ...
Value stream mapping has supporting methods that are often used in Lean environments to analyze and design flows at the system level (across multiple processes).
Although value stream mapping is often associated with manufacturing, it is also used in logistics, supply chain, service related industries, healthcare, software development, product development, and administrative and office processes." [Value stream mapping. Wikipedia]
This value stream map template explains the meanings of the VSM design elements.
This Value stream map template for the ConceptDraw PRO diagramming and vector drawing software is included in the Value Stream Mapping solution from the Quality area of ConceptDraw Solution Park.
VSM template
Mind Maps for Business - SWOT Analysis

How to Make SWOT Analysis in a Word Document

Business Tools Perceptual Mapping

 Marketing Diagrams
Marketing Diagrams solution extends ConceptDraw PRO diagramming software with abundance of samples, templates and vector design elements intended for easy graphical visualization and drawing different types of Marketing diagrams and graphs, including Branding Strategies Diagram, Five Forces Model Diagram, Decision Tree Diagram, Puzzle Diagram, Step Diagram, Process Chart, Strategy Map, Funnel Diagram, Value Chain Diagram, Ladder of Customer Loyalty Diagram, Leaky Bucket Diagram, Promotional Mix Diagram, Service-Goods Continuum Diagram, Six Markets Model Diagram, Sources of Customer Satisfaction Diagram, etc. Analyze effectively the marketing activity of your company and apply the optimal marketing methods with ConceptDraw PRO software.
 Value Stream Mapping
Value stream mapping solution extends ConceptDraw PRO software with templates, samples and vector stencils for drawing the Value Stream Maps (VSM) in lean manufacturing practice.
VSM

SWOT Analysis

- Porters Value Chain Analysis For Service Industry
- Porters Value Chain Marketing And Sales Examples
- Porters Value Chain Service Industry
- Porter Value Chain Service Industry
- Competitor Analysis | Porter's Value Chain | Business Productivity ...
- Service Value Chain Analysis
- Porter's value chain matrix diagram
- Value Chain For Service Industry
- Infrastructure Value Chain Analysis
- Services Value Chain
- Porter S Value Chain
- Porter's Value Chain | Competitor Analysis | Process Flowchart ...
- Porter's Value Chain | Competitor Analysis | Porter's value chain ...
- Porter's Value Chain | Block diagram - Porter's five forces model ...
- Flow chart Example. Warehouse Flowchart | Porter's value chain ...
- Authority Matrix Diagram Software | SWOT analysis matrix diagram ...
- Porter's Value Chain | Competitor Analysis | Process Flowchart ...
- Competitor Analysis | Total Quality Management Value | Process ...
- Authority Matrix Diagram Software | PROBLEM ANALYSIS ...
- Porter's value chain matrix diagram | CASA exposition | Ring ...