UML Component Diagram Example - Online Shopping

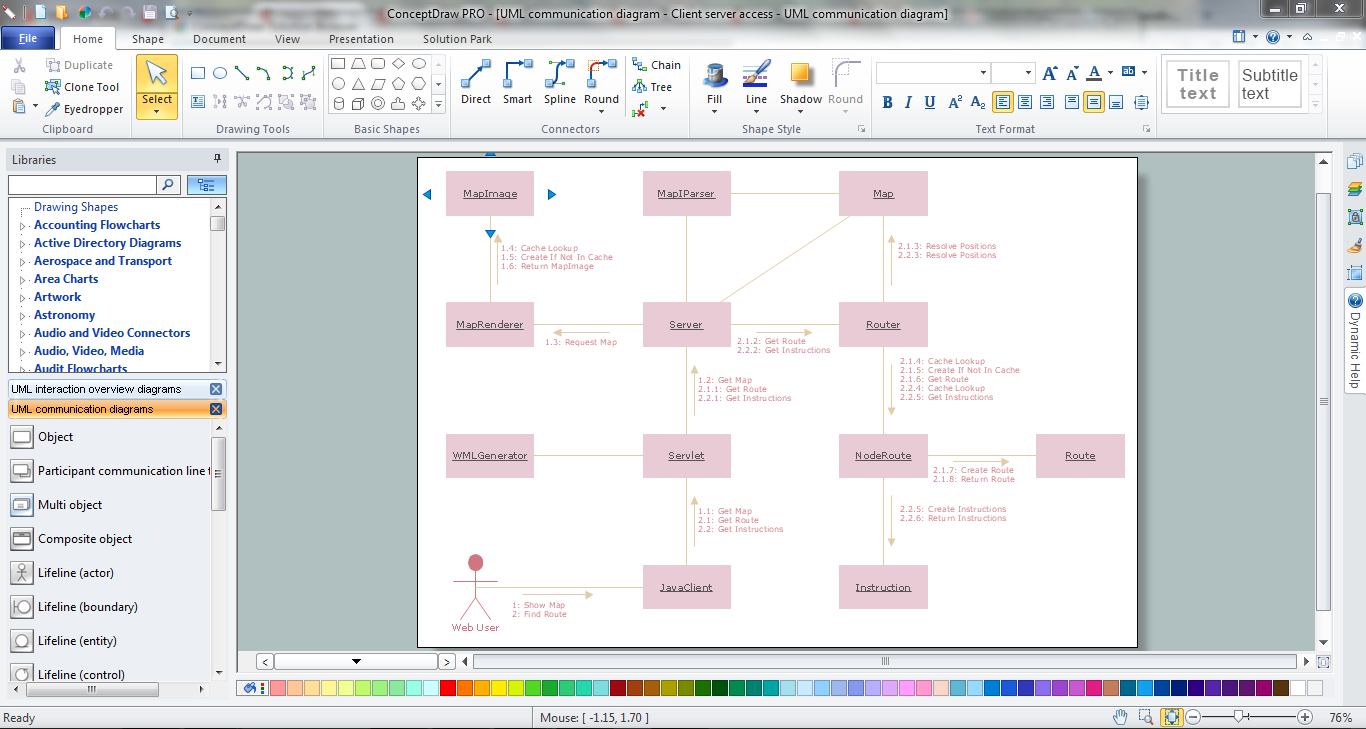
UML Collaboration Diagram (UML2.0)


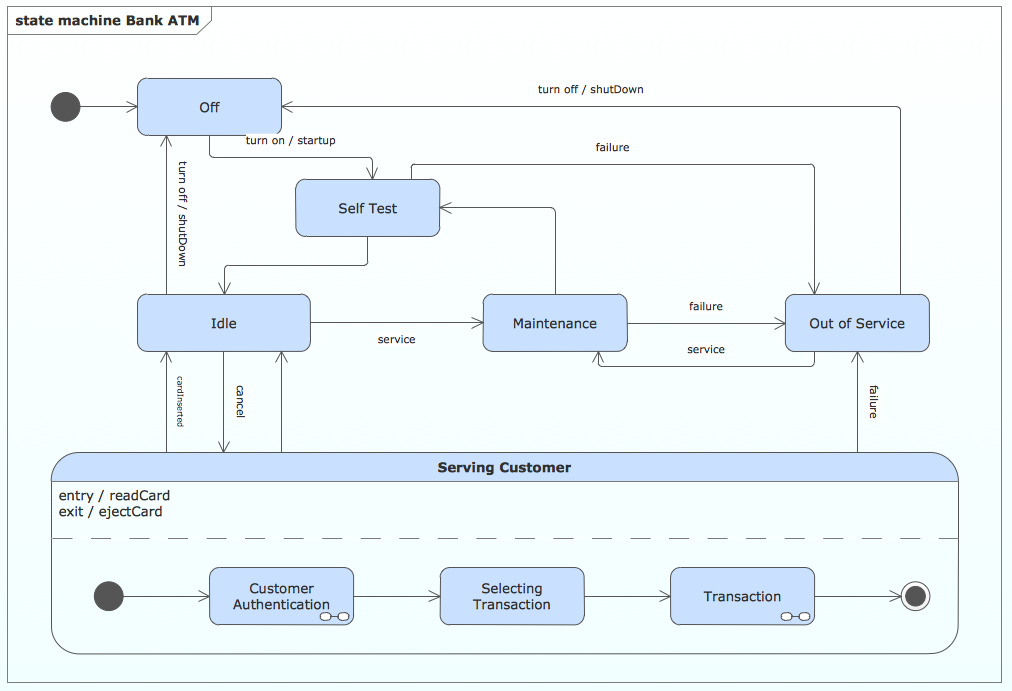
State Diagram Example — Online Store

Online Diagram Tool
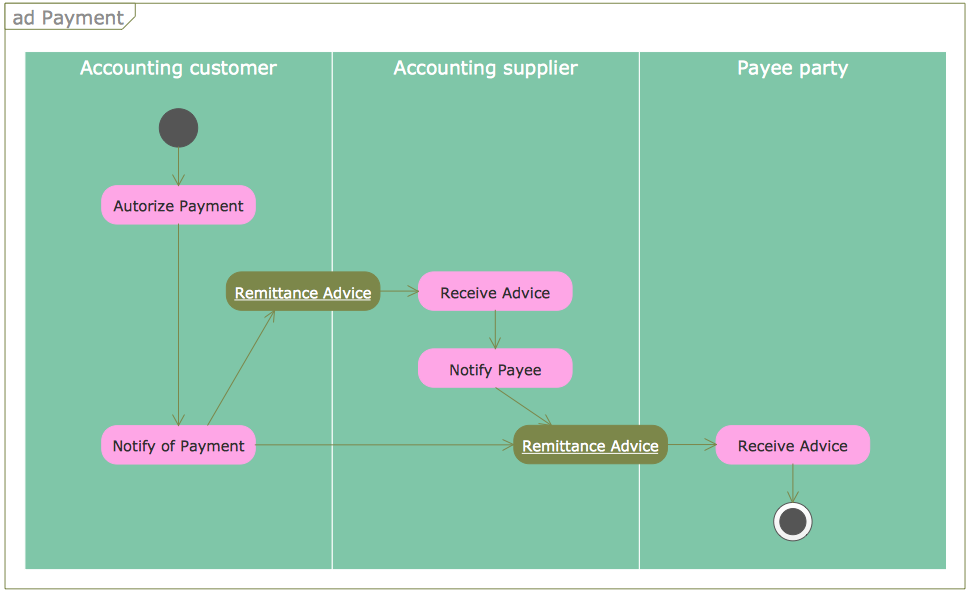
UML Activity Diagram

 ConceptDraw Solution Park
ConceptDraw Solution Park collects graphic extensions, examples and learning materials
Example of DFD for Online Store (Data Flow Diagram)


State Machine Diagram
UML Deployment Diagram
 Fault Tree Analysis Diagrams
This solution extends ConceptDraw DIAGRAM.5 or later with templates, fault tree analysis example, samples and a library of vector design elements for drawing FTA diagrams (or negative analytical trees), cause and effect diagrams and fault tree diagrams.
HelpDesk
How to Create a Timeline Diagram

Amazon Web Services Diagrams diagramming tool for architecture

ConceptDraw Solution Park
ConceptDraw Solution Park collects graphic extensions, examples and learning materials
 Rapid UML
Rapid UML solution extends ConceptDraw DIAGRAM software with templates, samples and libraries of vector stencils for quick drawing the UML diagrams using Rapid Draw technology.
 Fishbone Diagrams
The Fishbone Diagrams solution extends ConceptDraw DIAGRAM software with the ability to easily draw the Fishbone Diagrams (Ishikawa Diagrams) to clearly see the cause and effect analysis and also problem solving. The vector graphic diagrams produced using this solution can be used in whitepapers, presentations, datasheets, posters, and published technical material.
HelpDesk
How to Create a UML Diagram Quickly
 Fishbone Diagram
Fishbone Diagrams solution extends ConceptDraw DIAGRAM software with templates, samples and library of vector stencils for drawing the Ishikawa diagrams for cause and effect analysis.
HelpDesk
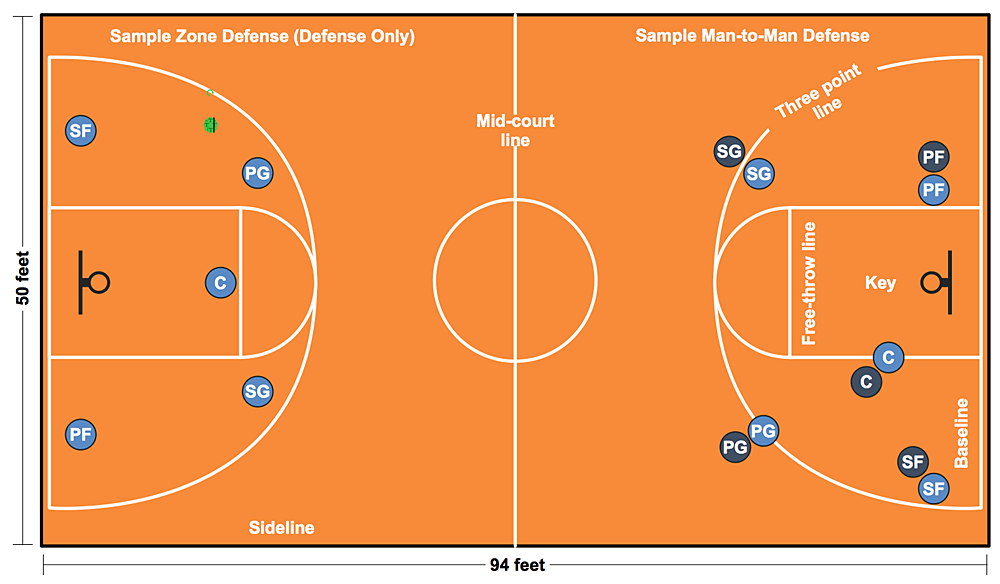
How to Make a Basketball Court Diagram
HelpDesk
How to a Draw Biology Diagram

- UML Component Diagram
- UML Component Diagram Example - Online Shopping | UML Tool ...
- State Diagram Example - Online Store | UML Component Diagram ...
- UML Component Diagram Example - Online Shopping | State ...
- Diagramming Software for Design UML Component Diagrams | UML ...
- UML Component Diagram | Diagramming Software for Design UML ...
- Online Diagram Tool | UML Component Diagram Example - Online ...
- State Diagram Example - Online Store | Diagramming Software for ...
- UML Deployment Diagram Example - ATM System | UML ...
- UML Component Diagram Example - Online Shopping ...
- Diagramming Software for Design UML State Machine Diagrams ...
- Diagramming Software for Design UML Component Diagrams | UML ...
- How to create your UML Diagram | UML Tool & UML Diagram ...
- UML Tool & UML Diagram Examples | UML Class Diagram Example ...
- UML Component Diagram. Design Elements | Diagramming ...
- ConceptDraw Solution Park | UML Component Diagram Example ...
- UML Collaboration Diagram Example Illustration | Diagramming ...
- Diagramming Software for Design UML Interaction Overview ...
- UML Use Case Diagram Example Registration System | Rapid UML ...
- Example of DFD for Online Store (Data Flow Diagram) DFD ...