UML Block Diagram

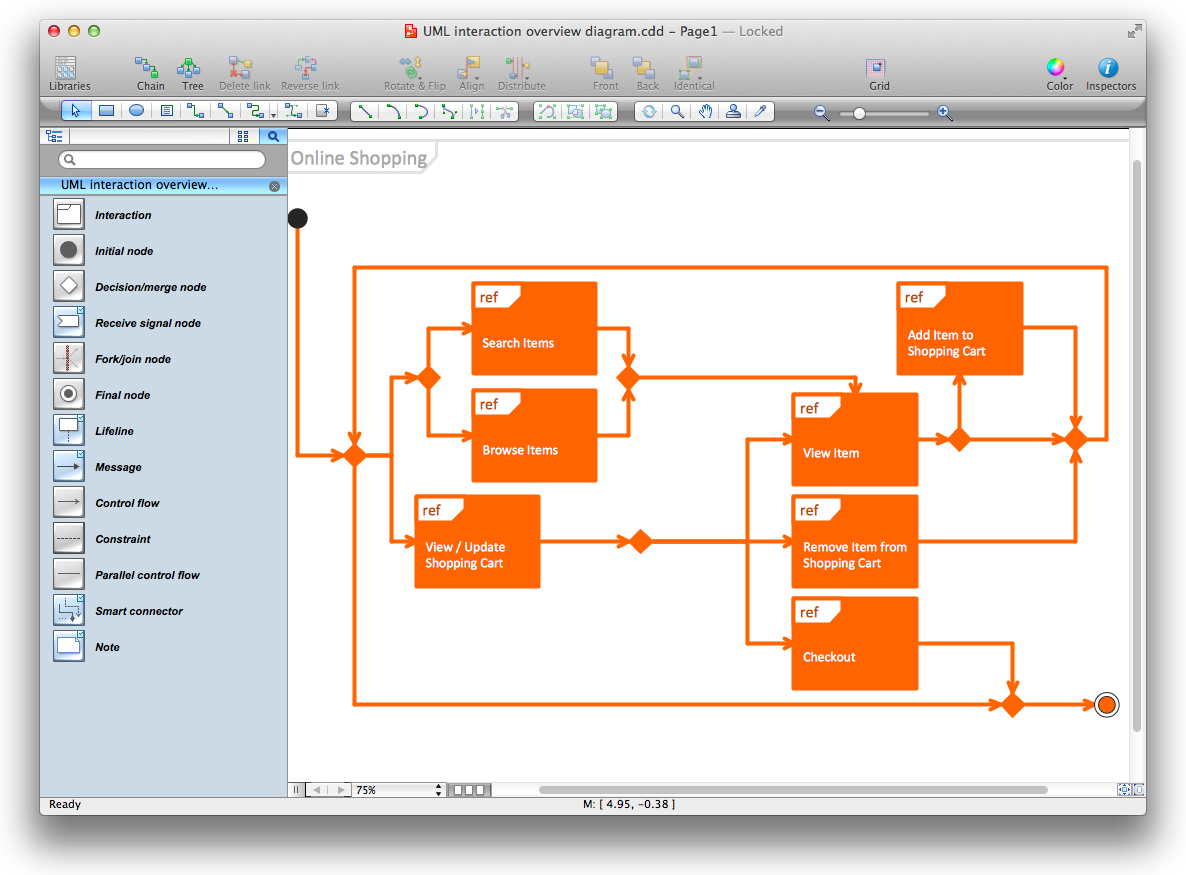
Diagramming Software for Design UML Interaction Overview Diagrams

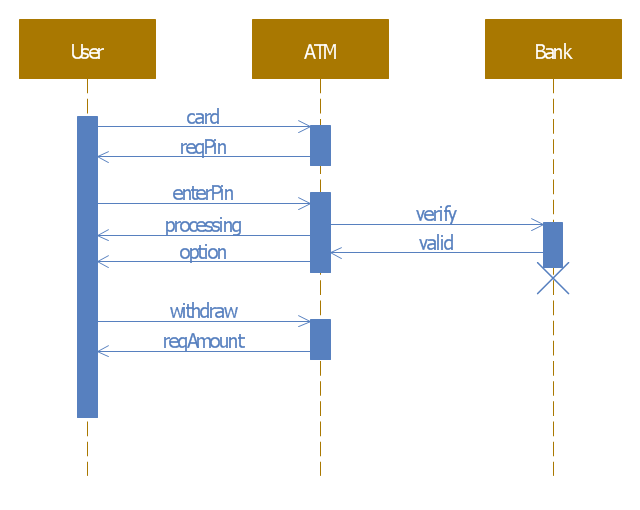
This example of automated teller machine (ATM) UML sequence diagram was created on the base of figure 5 "Sequence diagram" on the webpage "Message Sequence Charts and their Ilk" from the website of the University of California Irvine (UCI) Donald Bren School of Information and Computer Sciences.
"A UML sequence diagram or SD is similar to an MSC but written with a different notation. Presumably the same semantic issues arise, but possibly not since UML semantics are not well-defined. An example is shown in Figure 5.
The timelines are dotted rather than solid, and the name of the component is inside a box at the head of each timeline. The narrow rectangles apparently show when a component is active (unsure precisely what "active" means). An X on a timeline indicates that the component ceases to exist in some sense (unsure precisely how this is meant also). In the example, the Bank timeline has an X simply as an example (presumably the Bank does continue to exist)."
[www.ics.uci.edu/ ~alspaugh/ cls/ shr/ msc.html]
This example of bank ATM sequence diagram was created using the ConceptDraw PRO diagramming and vector drawing software extended with the ATM UML Diagrams solution from the Software Development area of ConceptDraw Solution Park.
Bank ATM UML sequence diagram
Entity Relationship Diagram Symbols

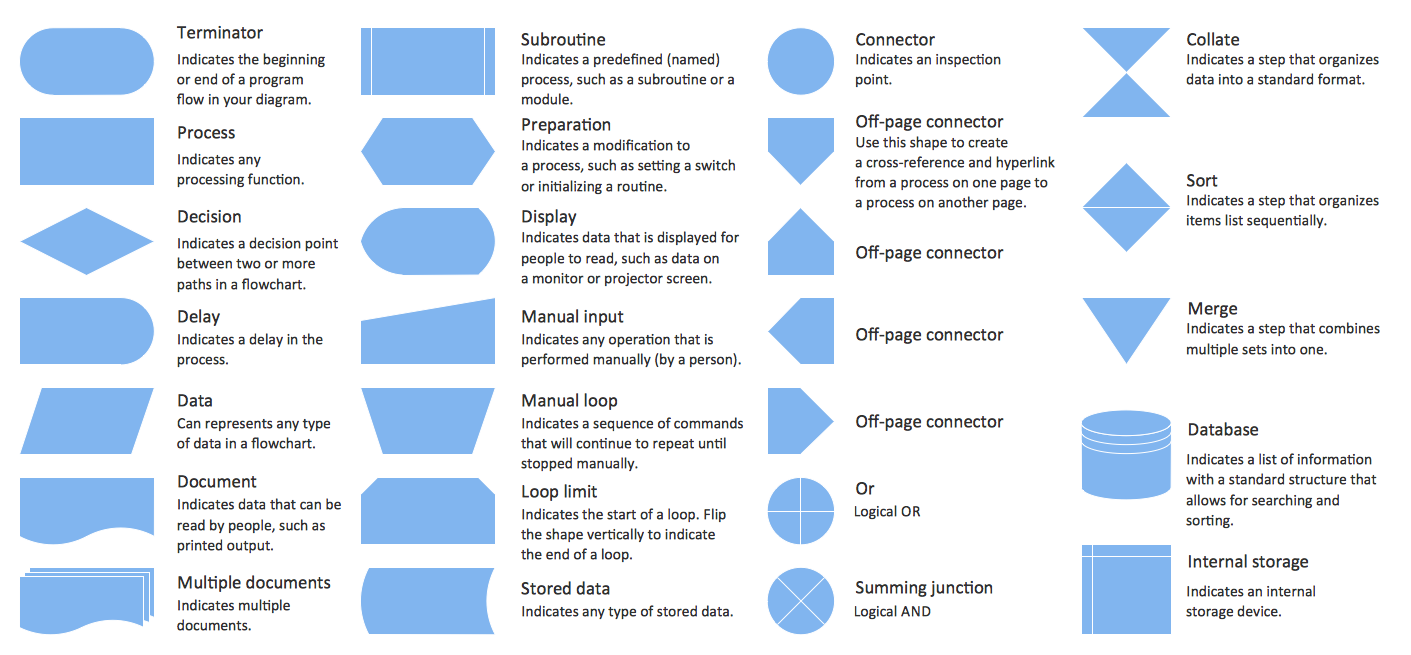
Conception d'organigramme Organigramme des symboles, formes, stencils et icônes
Active Directory Diagram

UML Diagram

Swim Lane Flowchart Symbols

How to Draw a Computer Network Diagrams

Diagramming Software for Design UML Collaboration Diagrams

- Uml Diagrams For Cloud Computing
- Interaction Overview Diagram | Diagramming Software for Design ...
- Football | Rapid UML | ATM UML Diagrams | Football Management ...
- UML use case diagram - Banking system | Use Case Diagram For ...
- Component Diagram Example Pdf
- UML Class Diagram Constructor | UML Block Diagram | Cisco ...
- Components of ER Diagram | Entity Relationship Diagram Symbols ...
- Cisco Network Diagram Software | UML Notation | 3 D Pics Of Triangle
- UML Use Case Diagram Example Registration System | UML activity ...
- Air Conditioner Uml Diagram