A five level pyramid model of different types of Information Systems based on the information processing requirement of different levels in the organization. The first level represents transaction processing systems to process basic data. The second level represents office support systems to process information in office. The third level represents management information systems to process information by managers. The fourth level represents decision support systems to process explicit knowledge. The fifth level represents executive information systems to process tacit knowledge.
"A Computer(-Based) Information System is essentially an IS using computer technology to carry out some or all of its planned tasks. The basic components of computer based information system are:
(1) Hardware - these are the devices like the monitor, processor, printer and keyboard, all of which work together to accept, process, show data and information.
(2) Software - are the programs that allow the hardware to process the data.
(3) Databases - are the gathering of associated files or tables containing related data.
(4) Networks - are a connecting system that allows diverse computers to distribute resources.
(5) Procedures - are the commands for combining the components above to process information and produce the preferred output.
The first four components (hardware, software, database and network) make up what is known as the information technology platform. Information technology workers could then use these components to create information systems that watch over safety measures, risk and the management of data. These actions are known as information technology services." [Information systems. Wikipedia]
This pyramid diagram was redesigned using the ConceptDraw PRO diagramming and vector drawing software from Wikimedia Commons file Five-Level-Pyramid-model.png. [commons.wikimedia.org/ wiki/ File:Five-Level-Pyramid-model.png]
This file is licensed under the Creative Commons Attribution 3.0 Unported license. [creativecommons.org/ licenses/ by/ 3.0/ deed.en]
The triangle chart example "Information systems types" is included in the Pyramid Diagrams solution from the Marketing area of ConceptDraw Solution Park.
Pyramid diagram

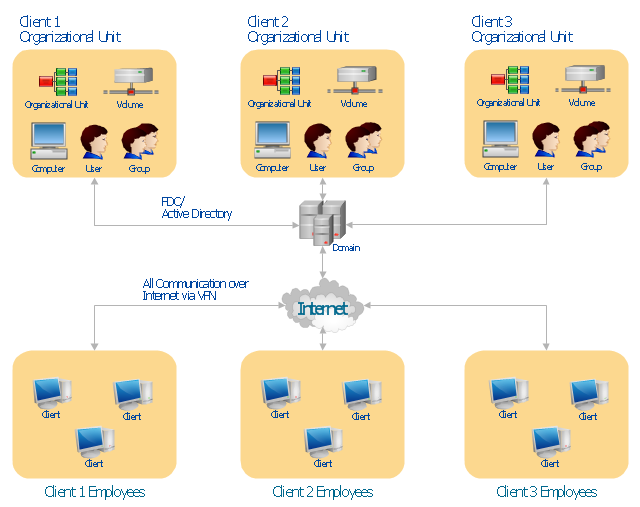
"Microsoft Windows 2000 Server introduces Active Directory to replace domain functionality. Active Directory will continue to get the job done, but in a much more efficient way. Active Directory can be replicated between multiple domain controllers, so no single system is critical. In this way, the crucial data stored within Active Directory is both redundant and load-balanced.
A directory, in the most generic sense, is a comprehensive listing of objects. A phone book is a type of directory that stores information about people, businesses, and government organizations. Phone books typically record names, addresses, and phone numbers. Active Directory is similar to a phone book in several ways, and it is far more flexible. Active Directory will store information about organizations, sites, systems, users, shares, and just about any other network object that you can imagine. Not all objects are as similar to each other as those stored in the phone book, so Active Directory includes the ability to record different types of information about different objects." [technet.microsoft.com/ en-us/ library/ bb742424.aspx]
The AD diagram example "Active Directory structure diagram" was created using the ConceptDraw PRO diagramming and vector drawing software extended with the Active Directory Diagrams solution from the Computer and Networks area of ConceptDraw Solution Park.
Active Directory network diagram
HelpDesk
How to Create an Effective Mind Map Using Topic Types


HelpDesk
How to Create a Stakeholder Onion Diagram Using ConceptDraw PRO

- 4 Level pyramid model diagram - Information systems types | 5 Level ...
- Chart Of Management Information System With Diagram
- 3 level pyramid model diagram of information systems types
- 4 Level pyramid model diagram - Information systems types ...
- Types Of Information System In Hierarchical Form
- Process Flowchart | Types of Flowchart - Overview | Basic Flowchart ...
- 5 Level pyramid model diagram - Information systems types | 4 Level ...
- 3 level pyramid model diagram of information systems types | 4 level ...
- 5 level pyramid model diagram of information systems types | 3 level ...
- Pyramid Diagram | 4 Level pyramid model diagram - Information ...
- Pyramid Diagram | 4 Level pyramid model diagram - Information ...
- Pyramid Diagram | 4 Level pyramid model diagram - Information ...
- How to Create Flowcharts for an Accounting Information System ...
- 4 Level pyramid model diagram - Information systems types | Types ...
- Pyramid Diagram | 4 Level pyramid model diagram - Information ...
- 5 Level pyramid model diagram - Information systems types
- UML Diagram Types List | 4 Level pyramid model diagram ...
- Pyramid Diagram | Pyramid Diagram | 4 Level pyramid model ...
- Process Flowchart | Types of Flowchart - Overview | Pyramid ...
- Types Information System Professional