How to Create a Pie Chart

The vector stencils library "Pyramid diagrams" contains 28 templates of pyramid diagrams, triangle charts and triangular schemes.
Use these templates to create your pyramid diagrams in the ConceptDraw PRO diagramming and vector drawing software extended with the Pyramid Diagrams solution from the Marketing area of ConceptDraw Solution Park.
Use these templates to create your pyramid diagrams in the ConceptDraw PRO diagramming and vector drawing software extended with the Pyramid Diagrams solution from the Marketing area of ConceptDraw Solution Park.
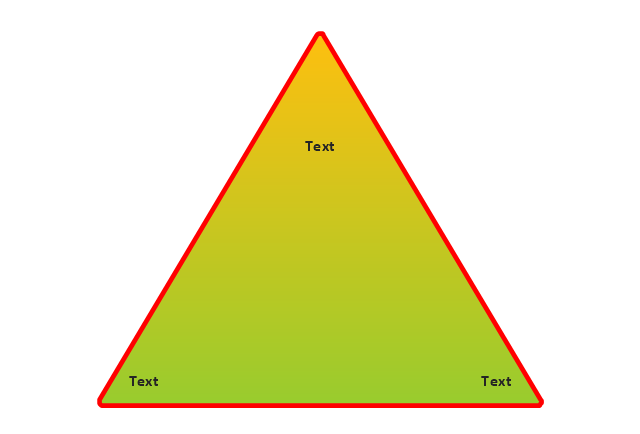
Pyramid 1
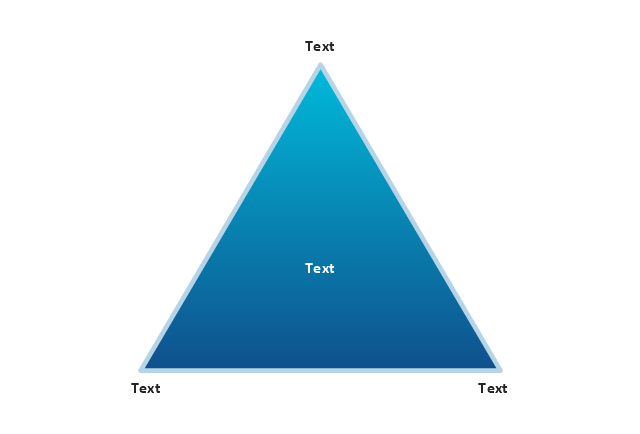
Pyramid 2
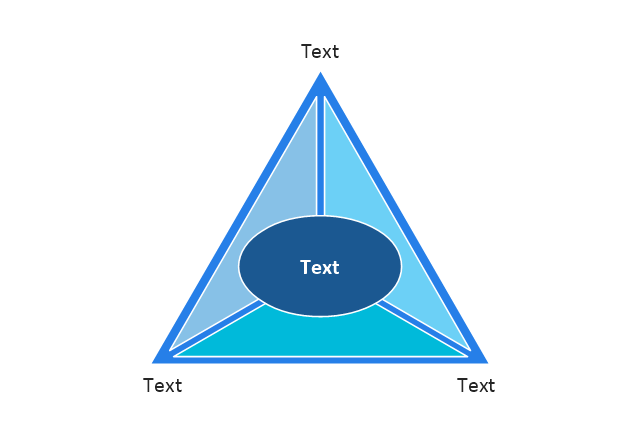
Pyramid 3
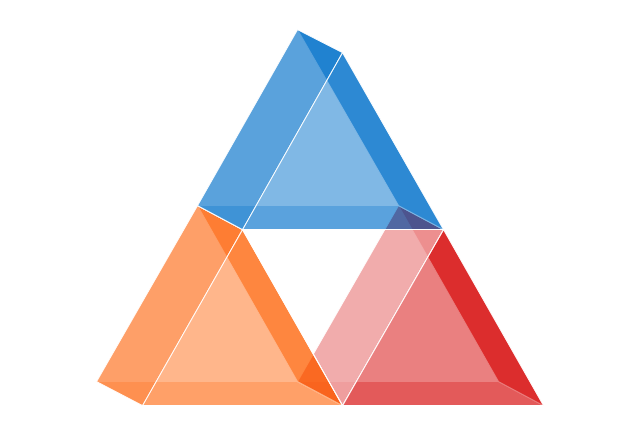
Pyramid 4
Pyramid 5
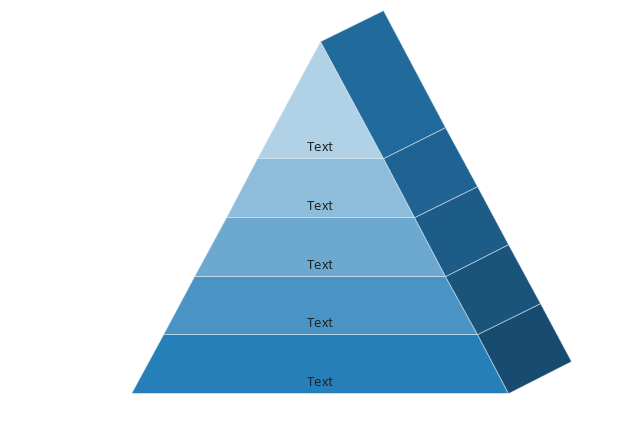
Pyramid 1 Isometric
Pyramid 2 Isometric
Pyramid 3 Isometric
Pyramid 4 Isometric
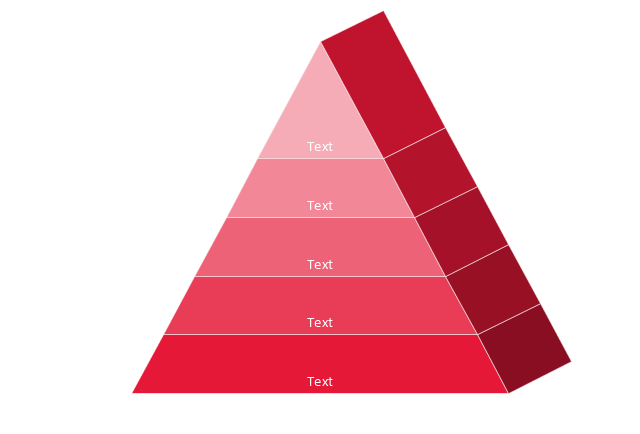
Pyramid 5 Isometric
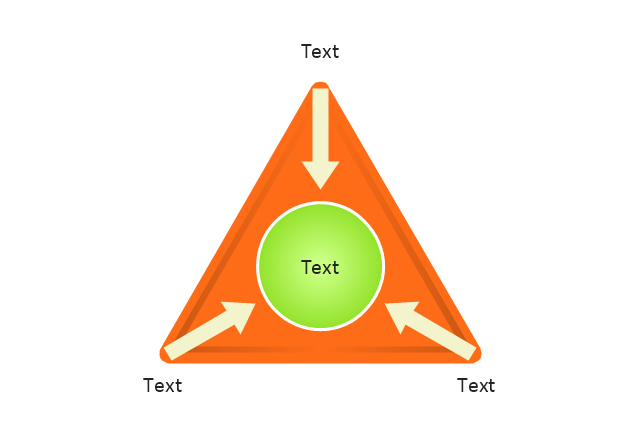
Triangle diagram, arrows
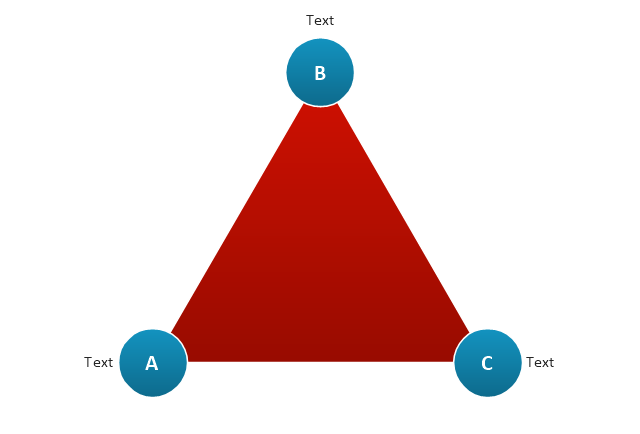
Triangle diagram
Triangular pyramid
Triangular diagram
Triangle scheme
Triangle chart

Triangle chart, isometric
Triangular scheme
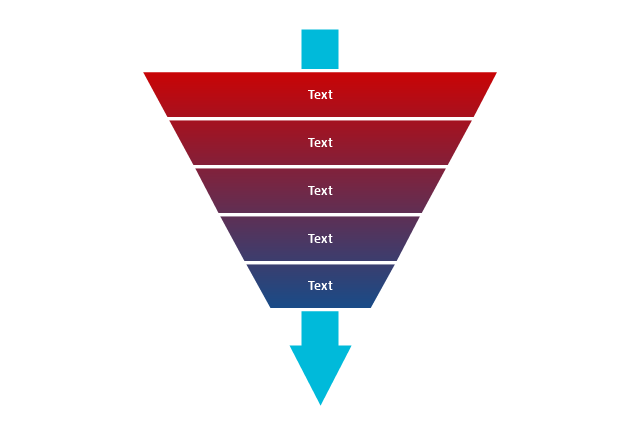
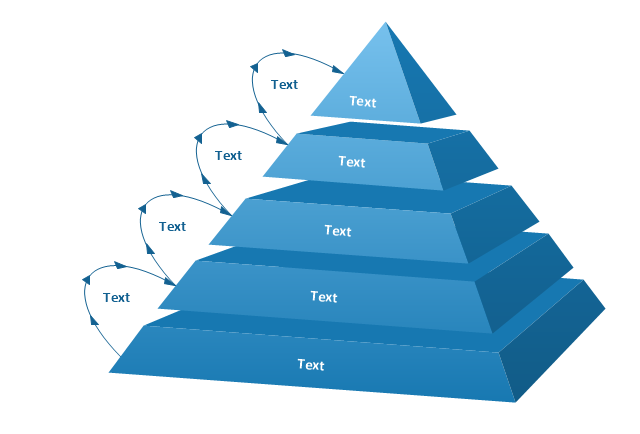
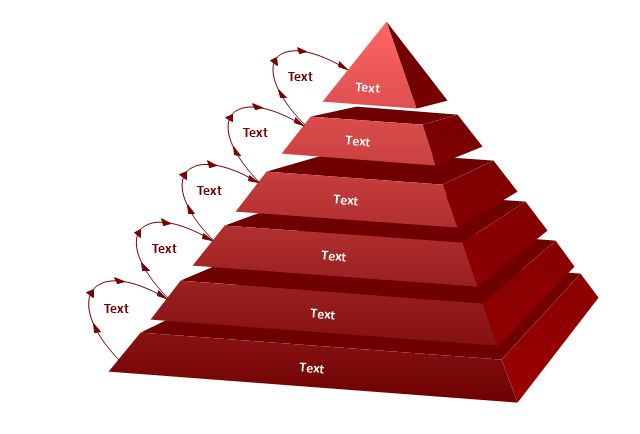
Arrowed block pyramid

Funnel diagram
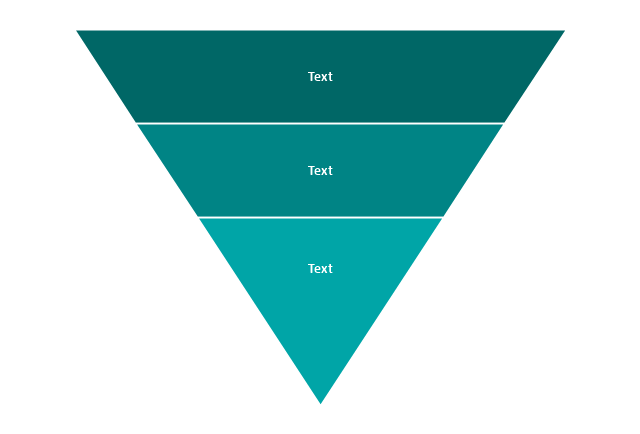
3-level funnel diagram
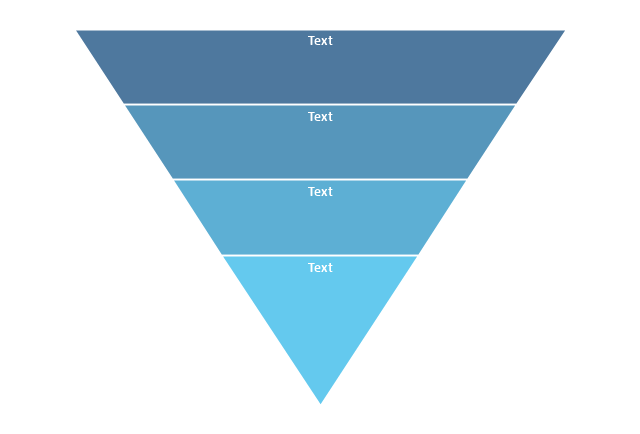
4-level funnel diagram
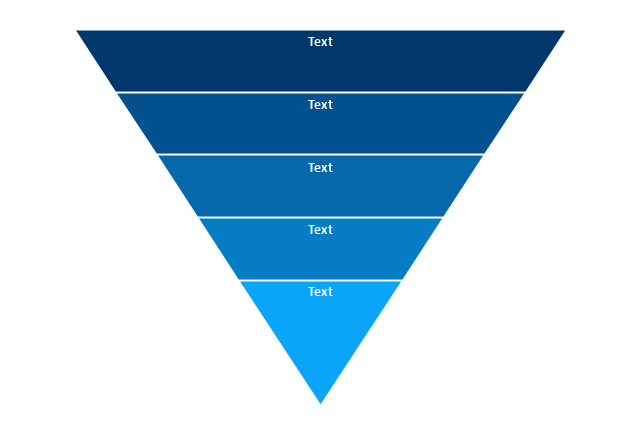
5-level funnel diagram
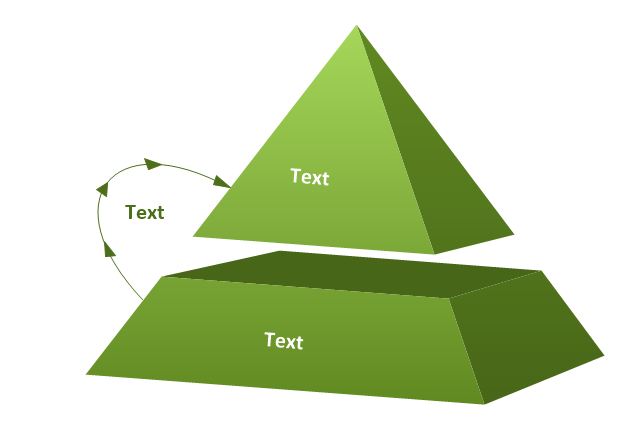
2-level pyramid diagram
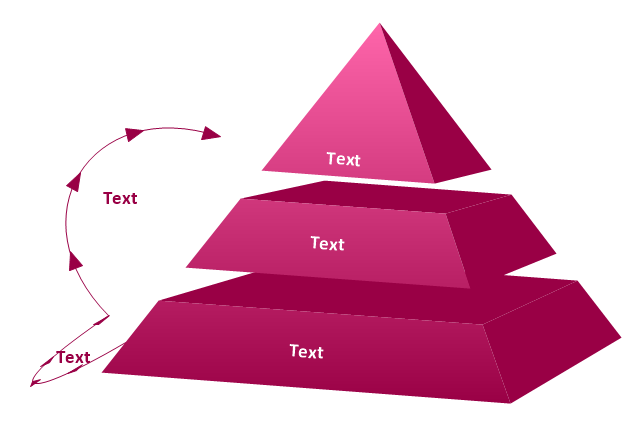
3-level pyramid diagram
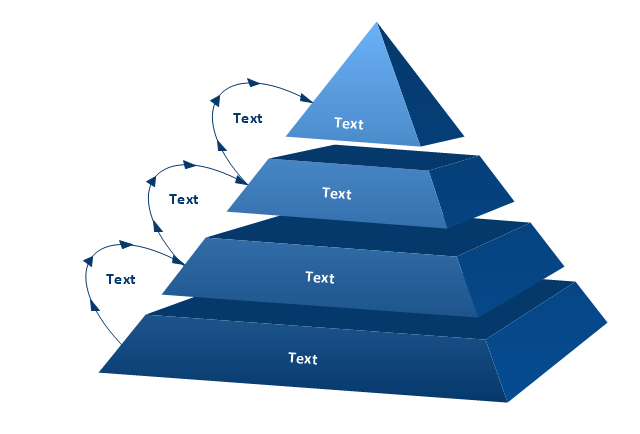
4-level pyramid diagram
5-level pyramid diagram
6-level pyramid diagram
Process Flow Chart Symbols

Pyramid Diagram

Entity Relationship Diagram Symbols

The vector stencils library "Pyramid diagrams" contains 28 templates of pyramid diagrams, triangle charts and triangular schemes.
Use these templates to create your pyramid diagrams in the ConceptDraw PRO diagramming and vector drawing software extended with the Pyramid Diagrams solution from the Marketing area of ConceptDraw Solution Park.
Use these templates to create your pyramid diagrams in the ConceptDraw PRO diagramming and vector drawing software extended with the Pyramid Diagrams solution from the Marketing area of ConceptDraw Solution Park.
Pyramid 1
Pyramid 2
Pyramid 3
Pyramid 4
Pyramid 5
Pyramid 1 Isometric
Pyramid 2 Isometric
Pyramid 3 Isometric
Pyramid 4 Isometric
Pyramid 5 Isometric
Triangle diagram, arrows
Triangle diagram
Triangular pyramid
Triangular diagram
Triangle scheme
Triangle chart
Triangle chart, isometric
Triangular scheme
Arrowed block pyramid
Funnel diagram
3-level funnel diagram
4-level funnel diagram
5-level funnel diagram
2-level pyramid diagram
3-level pyramid diagram
4-level pyramid diagram
5-level pyramid diagram
6-level pyramid diagram
Pyramid Diagram

Basic Flowchart Symbols and Meaning


Pyramid Diagram

Pyramid Diagram

- Arrow circle chart - Template | Picture graph - Template | Education ...
- Circular Flow Diagram Template | Triangle scheme with arrows ...
- Triangle Pie Chart
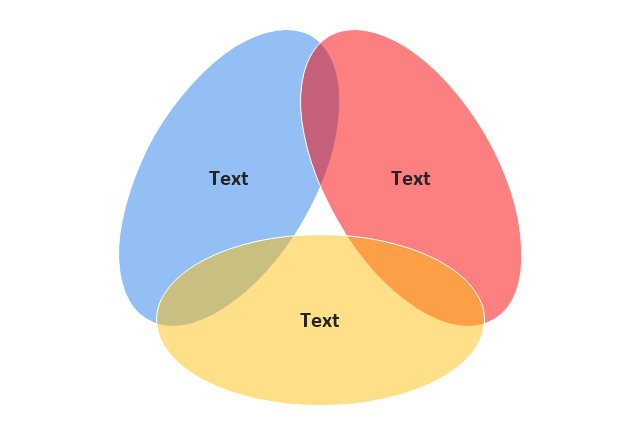
- Triangular Venn diagram - Template | Pyramid Diagram | Pyramid ...
- Circular arrows diagrams - Vector stencils library | Triangle scheme ...
- Chart For Triangular Pyramid
- Triangular Venn diagram - Template | Pyramid diagrams - Vector ...
- Chart Arrows
- Pyramid Diagrams | Divided Triangle Graph