Tree Network Topology Diagram

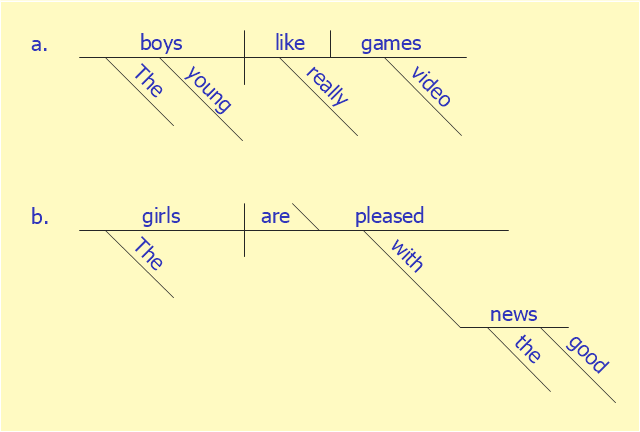
This sentence diagram example was redesigned from the Wikipedia file: Examples of Reed-Kellogg diagrams.jpg.
[en.wikipedia.org/ wiki/ File:Examples_ of_ Reed-Kellogg_ diagrams.jpg]
This file is licensed under the Creative Commons Attribution-Share Alike 3.0 Unported license. [creativecommons.org/ licenses/ by-sa/ 3.0/ deed.en]
"Most methods of diagramming in pedagogy are based on the work of Alonzo Reed and Brainerd Kellogg in their book Higher Lessons in English, first published in 1877, though the method has been updated with recent understanding of grammar. Reed and Kellogg were preceded, and their work probably informed, by W. S. Clark, who published his "balloon" method of depicting grammar in his 1847 book A Practical Grammar: In Which Words, Phrases & Sentences are Classified According to Their Offices and Their Various Relationships to Each Another.
Some schoolteachers continue to use the Reed-Kellogg system in teaching grammar, but others have discouraged it in favor of more modern tree diagrams. However, these modern tree structures draw on techniques that were already present in Reed-Kellogg diagrams. Reed and Kellogg defend their system in the preface to their grammar:
The Objections to the Diagram. - The fact that the pictorial diagram groups the parts of a sentence according to their offices and relations, and not in the order of speech, has been spoken of as a fault. It is, on the contrary, a merit, for it teaches the pupil to look through the literary order and discover the logical order. He thus learns what the literary order really is, and sees that this may be varied indefinitely, so long as the logical relations are kept clear.
The assertion that correct diagrams can be made mechanically is not borne out by the facts. It is easier to avoid precision in oral analysis than in written. The diagram drives the pupil to a most searching examination of the sentence, brings him face to face with every difficulty, and compels a decision on every point.
These statements bear witness to the fact that Reed-Kellogg diagrams abstract away from actual word order in order to focus more intently on how words in sentences function and relate to each other." [Sentence diagram. Wikipedia]
The examples of Reed-Kellogg diagrams was created using the ConceptDraw PRO diagramming and vector drawing software extended with the Language Learning solution from the Science and Education area of ConceptDraw Solution Park.
Sentence diagram
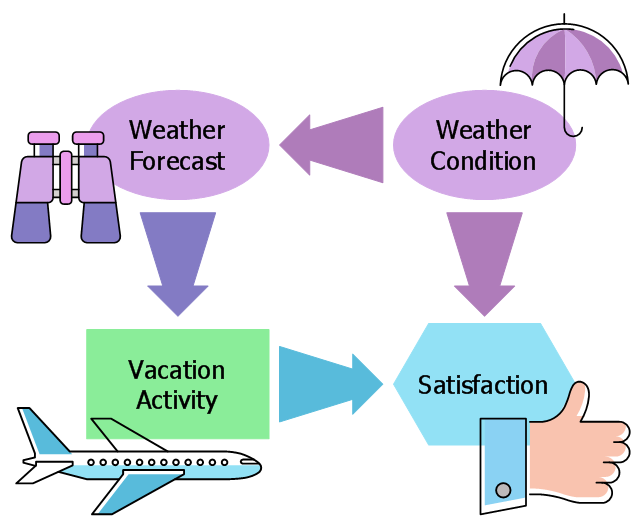
This decision diagram example was designed on the base of the Wikimedia Commons file: Simple Influence Diagram.svg.
[commons.wikimedia.org/ wiki/ File:Simple_ Influence_ Diagram.svg]
This file is made available under the Creative Commons CC0 1.0 Universal Public Domain Dedication. [creativecommons.org/ publicdomain/ zero/ 1.0/ deed.en]
"An influence diagram (ID) (also called a relevance diagram, decision diagram or a decision network) is a compact graphical and mathematical representation of a decision situation. It is a generalization of a Bayesian network, in which not only probabilistic inference problems but also decision making problems (following the maximum expected utility criterion) can be modeled and solved.
ID was first developed in the mid-1970s by decision analysts with an intuitive semantic that is easy to understand. It is now adopted widely and becoming an alternative to the decision tree which typically suffers from exponential growth in number of branches with each variable modeled. ID is directly applicable in team decision analysis, since it allows incomplete sharing of information among team members to be modeled and solved explicitly. Extensions of ID also find their use in game theory as an alternative representation of the game tree." [Influence diagram. Wikipedia]
The example "Influence diagram" was designed using ConceptDraw software extended with Decision Making solution from Management area of ConceptDraw Solution Park.
Decision diagram example
This example was redesigned from the Wikimedia Commons file: Example of High Level Fault Tree.jpg. [commons.wikimedia.org/ wiki/ File:Example_ of_ High_ Level_ Fault_ Tree.jpg]
"Risk assessment is the determination of quantitative or qualitative value of risk related to a concrete situation and a recognized threat (also called hazard). Quantitative risk assessment requires calculations of two components of risk (R):, the magnitude of the potential loss (L), and the probability (p) that the loss will occur. Acceptable risk is a risk that is understood and tolerated usually because the cost or difficulty of implementing an effective countermeasure for the associated vulnerability exceeds the expectation of loss.
In all types of engineering of complex systems sophisticated risk assessments are often made within Safety engineering and Reliability engineering when it concerns threats to life, environment or machine functioning. The nuclear, aerospace, oil, rail and military industries have a long history of dealing with risk assessment. Also, medical, hospital, social service and food industries control risks and perform risk assessments on a continual basis. Methods for assessment of risk may differ between industries and whether it pertains to general financial decisions or environmental, ecological, or public health risk assessment." [Risk assessment. Wikipedia]
The FTA diagram example "High level fault tree" was created using the ConceptDraw PRO diagramming and vector drawing software extended with the Fault Tree Analysis Diagrams solution from the Engineering area of ConceptDraw Solution Park.
FTA diagram

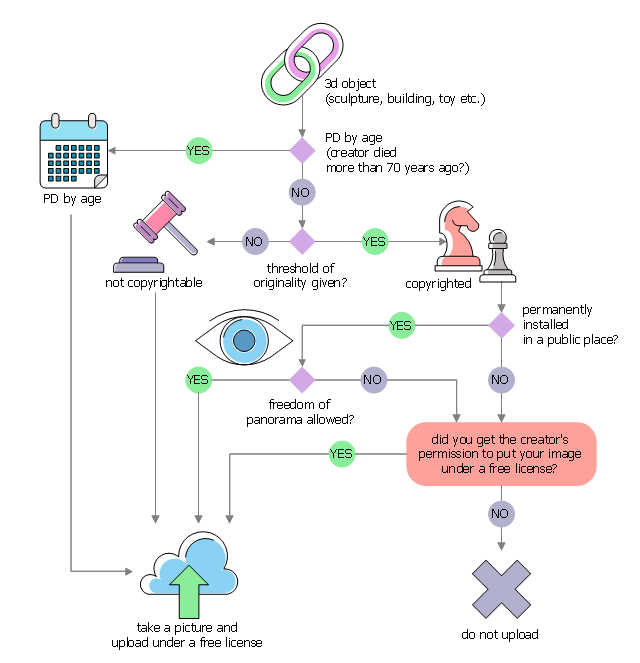
This example was designed on the base of the Wikimedia Commons file: Derivative Works Decision Tree.svg.
"Decision tree for authorization (or not) of derivative works on Commons"
[commons.wikimedia.org/ wiki/ File:Derivative_ Works_ Decision_ Tree.svg]
"Wikimedia Commons is a shared free image repository. Rather than uploading the same image to some 720 wikis individually, images can be uploaded to commons and can be used from every wiki. This both saves time and server resources." [Wikipedia:Commons Upload Campaign. Wikipedia]
The diagram example "Derivative works decision tree" was designed using ConceptDraw software extended with Decision Making solution from Management area of ConceptDraw Solution Park.
Decision diagram example
Hybrid Network Topology

Pyramid Chart Examples

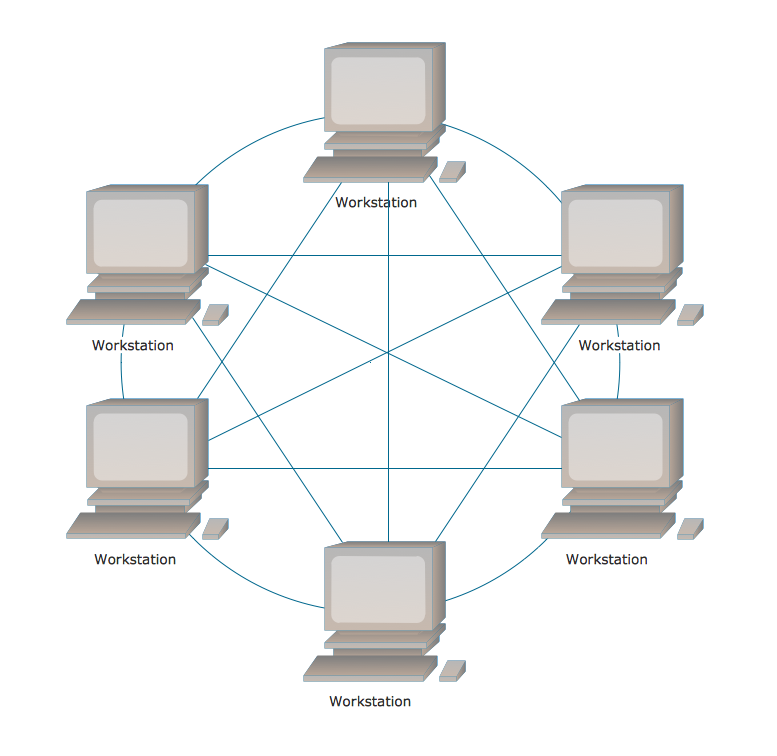
Fully Connected Network Topology Diagram
 Crow's Foot Notation
Crow’s Foot Notation solution extends ConceptDraw DIAGRAM software with powerful drawing tools, samples and library of predesigned vector Crow's Foot notation icons to help you easy describe the databases using the Entity-Relationship models and design professional-looking ER diagrams based on the popular Crow's Foot notation.
Pyramid Diagram

- Entity-Relationship Diagram (ERD) | Money Tree Diagram Wikipedia
- Cause and Effect Analysis
- Interrelationship Diagram Wikipedia
- Root cause analysis tree diagram - Sale problem solution | Root ...
- Root cause analysis tree diagram - Template | How To Create Root ...
- Wiki Fishbone Diagram
- English Tree Diagram
- Pert Diagram Wiki
- Design elements - Fault tree analysis diagrams | Audit failure - Fault ...
- Sentence Structure Tree Diagram