 Travel Infographics
Travel Infographics solution greatly extends the ConceptDraw DIAGRAM functionality making it the best travel infographics design software. Being intended for all specialists in the travel sphere, travel agents, marketers, advertisers, PR specialists, travelers and all other people related with tourism and rest, it contains professionally-designed samples, travel infographics template, and libraries with large variety of ready-made travel infographic vector clipart, design objects and travel infographics icons for drawing exceptional travel infographics and business travel infographics, travel illustrations, presentations, diagrams, schematics, plans, maps, posters, billboards, advertising, marketing, and other materials on the subject of travel and tourism, outdoor activities and extreme sports.
Travel Infographics

Travel Infographics Template

Business Travel Infographics

Best Travel Infographics

Travel Infographic Vector

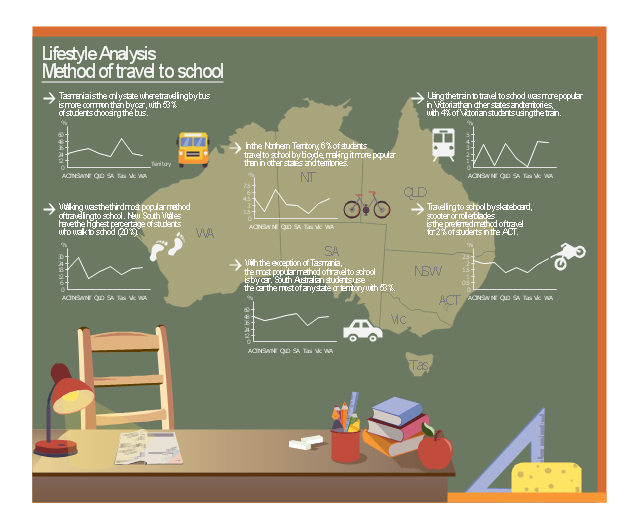
This example was designed on the base of infographic "Lifestyle Analysis. Method of travel to school in 2011" from the CensusAtSchool Australia website of the Australian Bureau of Statistics (ABS). [abs.gov.au/ websitedbs/ cashome.nsf/ 4a256353001af3ed4b2562bb00121564/ 41b786978bda4617ca25795d0004f35b/ $FILE/ ATT1ZZFV.pdf/ 1infographic_ travel_ 2011.pdf]
"National Summary Tables.
These tables indicate the trends, habits, attitudes and lifestyles of Australian students; however, they don't represent all Australian students, just those who voluntarily completed questionnaires. ...
Tables ... have infographics that you can view and download." [abs.gov.au/ websitedbs/ cashome.nsf/ 4a256353001af3ed4b2562bb00121564/ 1b426c2827e1d7f9ca2578db0015e3b1!OpenDocument]
The infographic example "Lifestyle analysis - Method of travel to school" was created using the ConceptDraw PRO diagramming and vector drawing software extended with the Education Infographics solition from the area "Business Infographics" in ConceptDraw Solution Park.
Educational infogram
Used Solutions
The vector stencils library "Travel and tourism pictograms" contains 20 travel and tourism pictograms.
Use it to create your infographics, illustrations and presentations.
The pictogram example "Design elements - Travel and tourism pictograms" was created using the ConceptDraw PRO diagramming and vector drawing software extended with the Pictorial infographics solution from the area "What is infographics" in ConceptDraw Solution Park.
Pictograms

Design Pictorial Infographics. Design Infographics

 Packages Area
We are excited to introduce a new Bundles Catalogue, where ConceptDraw products are paired together or offered with thematic set of paid solutions.
 ConceptDraw Solution Park
ConceptDraw Solution Park collects graphic extensions, examples and learning materials
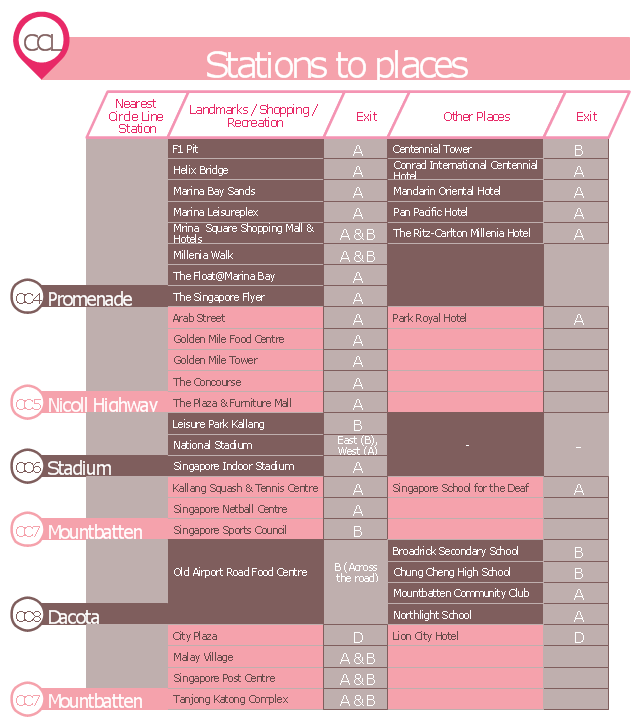
This typography infographics example was redesigned from the Wikimedia Commons file: CCLStationstoplaces.jpg. [commons.wikimedia.org/ wiki/ File:CCLStationstoplaces.jpg]
This file is licensed under the Creative Commons Attribution-Share Alike 3.0 Unported license. [creativecommons.org/ licenses/ by-sa/ 3.0/ deed.en]
"The Circle Line (CCL) is Singapore's fourth Mass Rapid Transit line. This underground line is 35.7 kilometres (22.2 mi) long with 31 stations (excluding Bukit Brown) and is fully automatically operated. It takes about one hour to travel from one end to the other. The line is coloured orange in the rail map.
As the name implies, the line is an orbital circle route linking all radial routes leading to the city. It also covers many parts of the Central Area. From Promenade, the line branches with one branch terminating at Dhoby Ghaut and the other terminating at Marina Bay. Transfers to the North South Line are provided at Bishan, Dhoby Ghaut and Marina Bay, East West Line at Paya Lebar and Buona Vista, and North East Line at Dhoby Ghaut, Serangoon and HarbourFront. The Downtown Line interchanges with the Circle Line at Bayfront and Promenade and future sections of the Downtown Line will interchange at Botanic Gardens and MacPherson. The future Thomson Line will interchange with the Circle Line at Caldecott and Marina Bay.
The Circle Line is the first medium capacity line in Singapore. As a medium capacity line, each Circle Line train has only three cars instead of the six-car configuration as seen on current MRT lines. Half a million people are expected to use the Circle Line each day. The line reduces travelling time for commuters by allowing them to shorten trips between north to east or north to west and vice versa, bypassing busy interchange like City Hall and Raffles Place." [Circle MRT Line. Wikipedia]
The example "CCL Stations to places - Infographics" was created using the ConceptDraw PRO diagramming and vector drawing software extended with the Typography Infographics solition from the area "What is infographics" in ConceptDraw Solution Park.
Infographics
The vector stencils library "Travel and tourism pictograms" contains 20 travelling and journey symbols.
Use it to draw your tour and trip infograms. The example "Travel and tourism pictograms - Vector stencils library" was created using the ConceptDraw PRO diagramming and vector drawing software extended with the Pictorial infographics solution from the area "What is infographics" in ConceptDraw Solution Park.
Use it to draw your tour and trip infograms. The example "Travel and tourism pictograms - Vector stencils library" was created using the ConceptDraw PRO diagramming and vector drawing software extended with the Pictorial infographics solution from the area "What is infographics" in ConceptDraw Solution Park.
Globe

Wind rose

Direction

Sign

Milestone

Flag

Campground

Tent

RV

Restaurant

Restrooms

Passport

Plane

Ticket

Briefcase

Case

Luggage

Mountains

Palm

Hotel

Pictorial Chart

Infographic Maker

- Travel Infographics Solution for ConceptDraw DIAGRAM Released
- Travel Infographics | Design elements - Travel and tourism ...
- Travel Infographics | How to Create a Powerful Infographic When ...
- Travel Infographics | Risk Diagram (Process Decision Program ...
- Travel Infographics | Transportation Infographics | Design Pictorial ...
- Basic of Flowchart: Meaning and Symbols | Travel Infographics
- Travel Infographics | Transportation Infographics | Travel and ...
- ConceptDraw Solution Park | Travel Infographics
- Travel and tourism pictograms | Travel Infographics | Travel Vector
- Survey on Why People Travel | Design Pictorial Infographics . Design ...