 Aerospace and Transport
This solution extends ConceptDraw PRO software with templates, samples and library of vector clipart for drawing the Aerospace and Transport Illustrations. It contains clipart of aerospace objects and transportation vehicles, office buildings and anci
Simple Flow Chart

 Transport Hazard Pictograms
Transport Hazard Pictograms solution includes large variety of specially developed samples with transport hazard symbols and pictograms, and the whole set of predesigned vector transport GHS pictograms download and used with ease from the Transport Hazard Pictograms library. Apply them for quick designing professional-looking infographics and diagrams, use them to create warning signboards and announcements on all stages of the transportation process, to place them on the transport vehicles and warehouses of transportation companies, at the transport documentation and on the websites of transport and logistics companies.
Road Transport - Design Elements

Radar Chart

Aircraft - Design Elements

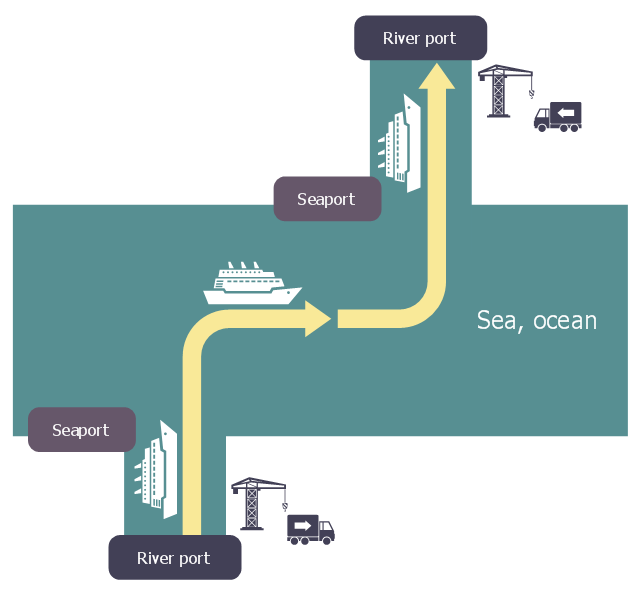
This logistic flow chart sample shows a chain of intermodal transport to link fluvio-maritime.
It was designed on the base of the Wikimedia Commons file: Logistique fluvio-maritime.jpg.
[commons.wikimedia.org/ wiki/ File:Logistique_ fluvio-maritime.jpg]
This file is licensed under the Creative Commons Attribution-Share Alike 3.0 Unported license. [creativecommons.org/ licenses/ by-sa/ 3.0/ deed.en]
"Intermodal freight transport involves the transportation of freight in an intermodal container or vehicle, using multiple modes of transportation (rail, ship, and truck), without any handling of the freight itself when changing modes. The method reduces cargo handling, and so improves security, reduces damage and loss, and allows freight to be transported faster. Reduced costs over road trucking is the key benefit for inter-continental use. This may be offset by reduced timings for road transport over shorter distances." [Intermodal freight transport. Wikipedia]
The logistic flowchart example "Intermodal transport chain" was created using ConceptDraw PRO diagramming and vector drawing software extended with the Logistics Flow Charts solution from the Business Processes area of ConceptDraw Solution Park.
Logistic flowchart
Flowchart Components

 Vehicular Networking
The Vehicular Networking solution extends the ConceptDraw PRO software functionality with specialized tools, wide variety of pre-made vector objects, collection of samples and templates in order to help network engineers design vehicular network diagrams for effective network engineering activity, visualize vehicular networks, develop smart transportation systems, design various types of vehicle network management diagrams, regional network diagrams, vehicular communication system diagrams, vehicular ad-hoc networks, vehicular delay-tolerant networks, and other network engineering schemes.
Spider Chart Template

Flow chart Example. Warehouse Flowchart


AWS Simple Icons for Architecture Diagrams

Sample Pictorial Chart. Sample Infographics
")
- Transport Vehicles Chart
- Transport Chart Full Hd
- Vehicle Transport Chart Photos
- Transport Vehicle Chart Name
- Vehicles Drawing Charts
- Transport Vehicle Chart
- Transport Vehicles On Road Photos
- Concept Maps | Name Water Transport Vehicles
- Pictures Of Water Transport Vehicles
- Aerospace and Transport | Different Petrol Vehicles Pictorial Chart
- Images Of Road Transport Chart For
- Transport Vehicle For Chart Making
- Water Transport Vehicles Picture Chart
- Flow chart Example. Warehouse Flowchart | Road transport - Vector ...
- Aerospace and Transport | Flow chart Example. Warehouse ...
- Industrial vehicles - Vector stencils library | Design elements ...
- HVAC Plans | Aerospace and Transport | Percentage Pie Chart . Pie ...
- Aircraft examples | Percentage Pie Chart . Pie Chart Examples ...
- Aerospace and Transport | Workflow diagrams - Vector stencils ...