This site uses cookies. By continuing to browse the ConceptDraw site you are agreeing to our Use of Site Cookies.

Map Infographic Tool

ConceptDraw is a data visualization tool, which can help you to create a map infographics. Anyone can do this, it's that easy!

Map Infographic Creator

Follow samples and map templates to create nfographic maps. It's super-easy!

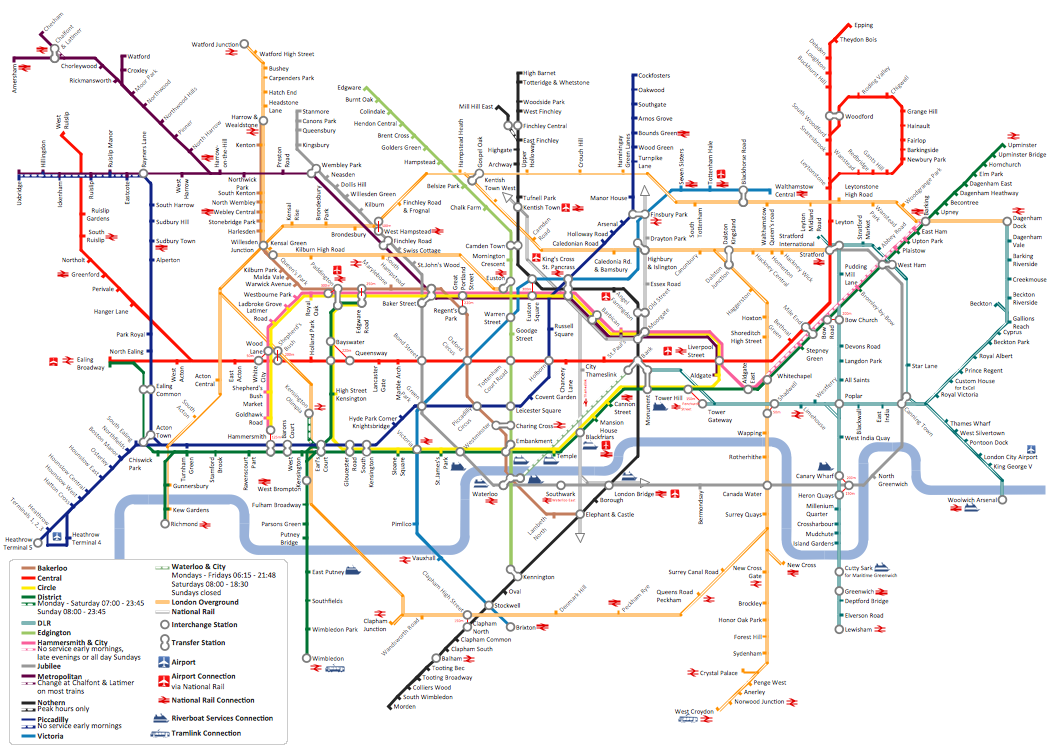
How to draw Metro Map style infographics? Moscow, New York, Los Angeles, London

The solution handles designs of any complexity, and the comprehensive library covers all key aspects of a transportation system. To further enhance your map design, there is the option to embed links, that can display station images or other relevant, important information. We have also included a set of samples in the solution, that show the possible real-world application — complex tube systems including the London Tube and New York City Subway show the level of detail possible when using the Metro Map Solution.

Infographic Maker

Infographic is a visual way of representing various information, data, knowledge in statistics, geography, journalism, education, and much more areas. ConceptDraw DIAGRAM supplied with Pictorial Infographics Solution from the “Infographics” Area, provides a set of powerful pictorial infographics tools. Thanks to them it is the best Infographic Maker.

Best Tool for Infographic Construction

ConceptDraw is a best data visualization tool that will allow everyone to create rich infographics and visualizations quickly and easily.

How to draw Metro Map style infographics? (London)

Tool to draw Metro Map styled inforgraphics. London Tube map sample.

Best Flowcharts

Flowcharts visualize a process or algorithm of program as step/operation blocks of various shapes connected with arrowed lines showed the process flow direction. They are used to visualize business or technical processes and software algorithms.

Conceptdraw DIAGRAM - feature-rich flowchart software. It will allow you to create professional looking flowcharts.

Scrum process work items and workflow

Teams working with Scrum methodology use the product backlog items (PBIs), bug work item types (WITs), reports and dashboards. SCRUM Workflow solution for ConceptDraw DIAGRAM software offers collection of samples, variety of predesigned objects, clipart and graphic elements, a set of Scrum process work items and workflow which are developed for agile teams working using Scrum.

Flow chart Example. Warehouse Flowchart

Warehouse Flowcharts are different diagrams describing wharehousing and inventory menagement processes. Typical purposes of warehouse flowcharts are evaluating warehouse performance and organizational performance, measuring efficiency of customer service. This type of workflow diagrams can be used for identifying any disconnection between business activities and business objectives.
Standard warehousing process flow diagram and standard workflow diagram used for process identification for further evaluating effectiveness and profitability of overall business process. Use the ConceptDraw DIAGRAM diagramming and vector drawing software extended with the Flowcharts solution from the Diagrams area of ConceptDraw Solution Park to design your own workflow diagrams, process flow diagram and flow charts. Need to use Process Flow Diagram for designing Warehouse packages flow.
ConceptDraw Arrows10 Technology

australia map, map of australia, map australia Australia Map

australia map, map of australia, map australia
For graphic artists creating accurate maps of Australia. The Australia Map solution - allows designers to map Australia for their needs, offers a collection of scalable graphics representing the political geography of Australia, split into distinct state