 Seven Basic Tools of Quality
Manage quality control in the workplace, using fishbone diagrams, flowcharts, Pareto charts and histograms, provided by the Seven Basic Tools of Quality solution.
Process Flowchart


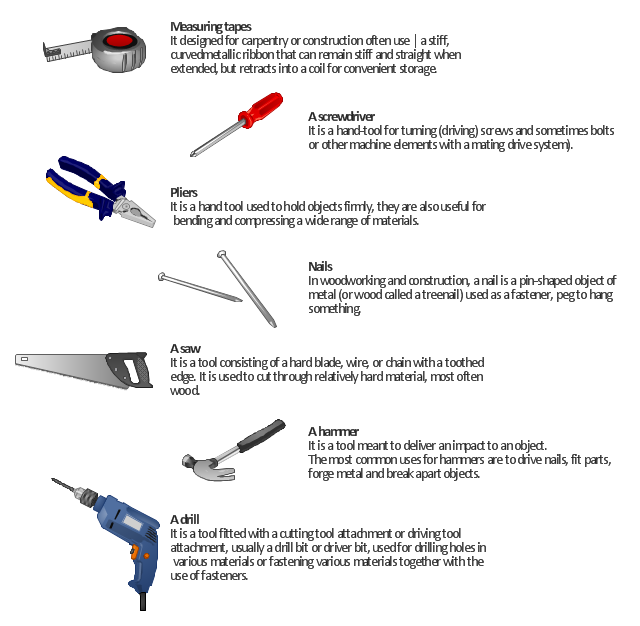
"A hand tool is any tool that is not a power tool – that is, one powered by hand (manual labour) rather than by an engine. Some examples of hand tools are hammers, spanners, pliers, screwdrivers and chisels. Hand tools are generally less dangerous than power tools." [Hand tool. Wikipedia]
"A power tool is a tool that is actuated by an additional power source and mechanism other than the solely manual labour used with hand tools. The most common types of power tools use electric motors. ...
Power tools are used in industry, in construction, in the garden, for housework tasks such as cooking, cleaning, and around the house for purposes of driving (fasteners), drilling, cutting, shaping, sanding, grinding, routing, polishing, painting, heating and more.
Power tools are classified as either stationary or portable, where portable means hand-held. Portable power tools have obvious advantages in mobility." [Power tool. Wikipedia]
The illustration example "7 tools that should be in every home" was created in the ConceptDraw PRO diagramming and vector drawing software using the Manufacturing and Maintenance solution from the Illustration area of ConceptDraw Solution Park.
Infographics
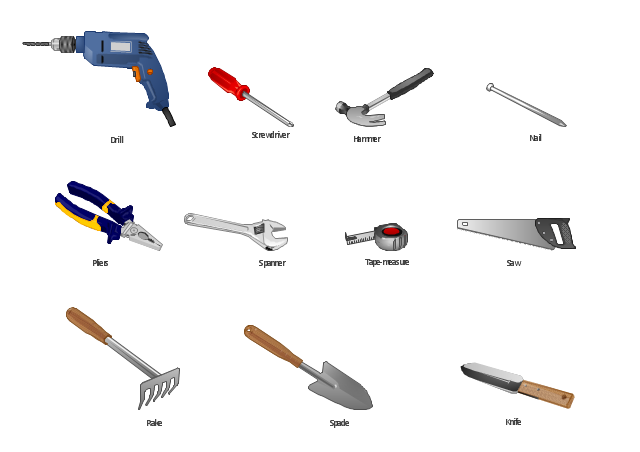
The vector stencils library "Tools" contains 11 clipart images of hand tools and instruments for drawing illustrations.
"A tool is any physical item that can be used to achieve a goal, especially if the item is not consumed in the process. Informally the word is also used to describe a procedure or process with a specific purpose. Tool use by humans dates back millions of years, and other animals are also known to employ simple tools.
Tools that are used in particular fields or activities may have different designations such as "instrument", "utensil", "implement", "machine", or "apparatus". The set of tools needed to achieve a goal is "equipment". The knowledge of constructing, obtaining and using tools is technology." [Tool. Wikipedia]
The clip art example "Tools - Vector stencils library" was created in ConceptDraw PRO diagramming and vector drawing software using the Manufacturing and Maintenance solution from the Illustration area of ConceptDraw Solution Park.
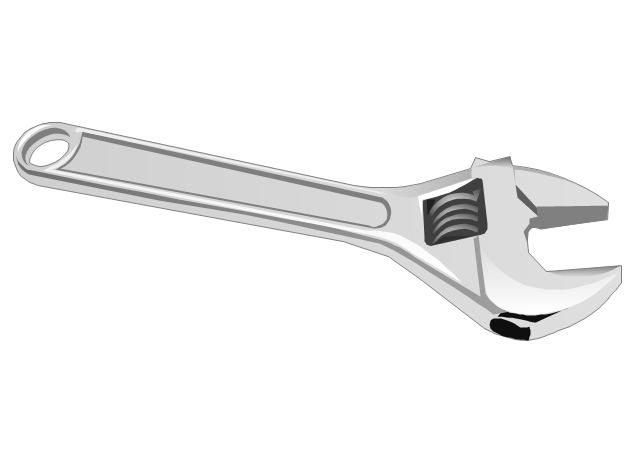
Adjustable spanner
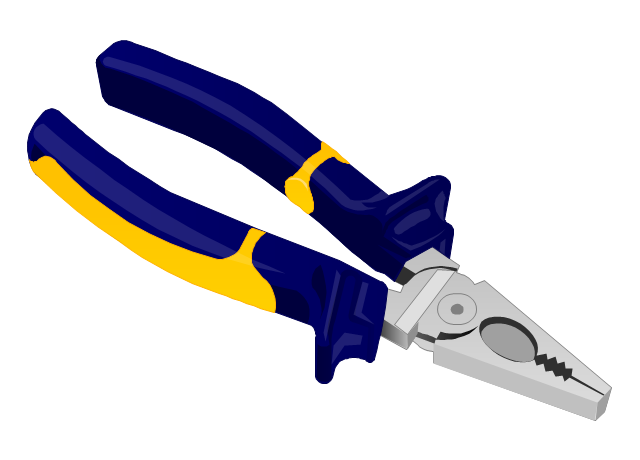
Lineman's pliers
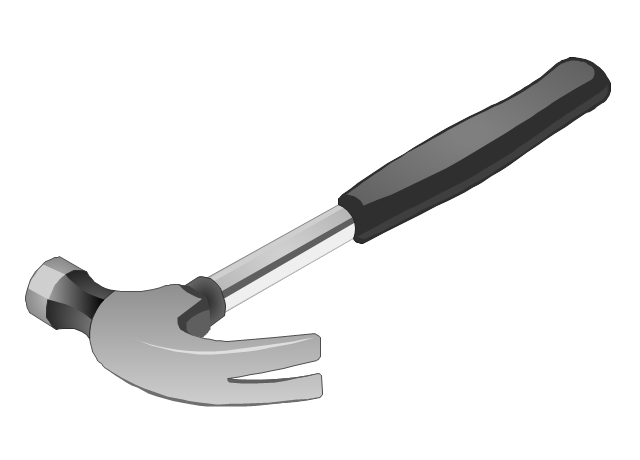
Claw hammer
Phillips screwdriver
Self-retracting tape measure
Crosscut hand saw
Nail

Hori-Hori garden knife
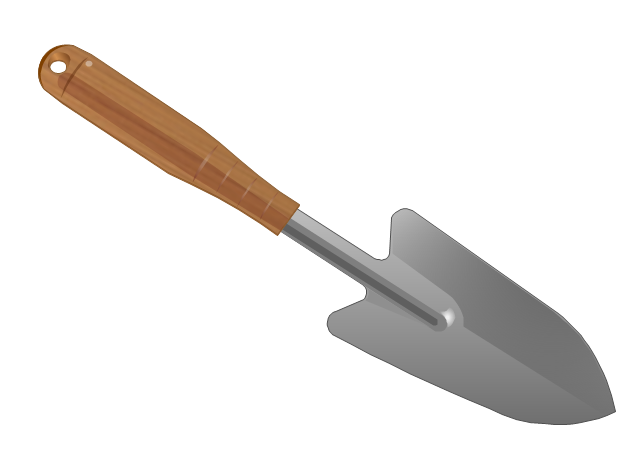
Gardening trowel
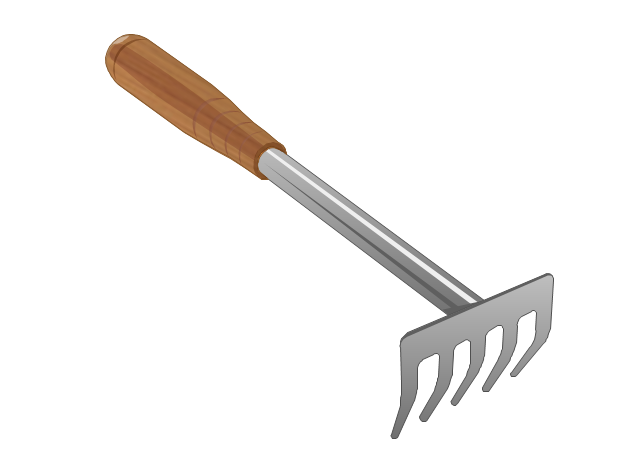
Garden rake
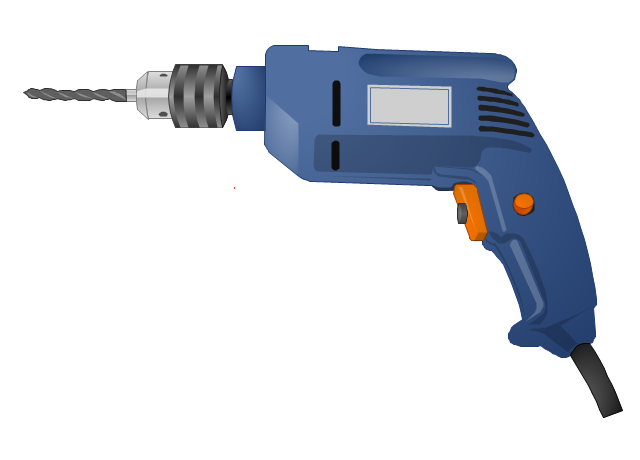
Pistol-grip electric drill
The vector stencils library "Tools" for the ConceptDraw PRO diagramming and vector drawing software contains 11 clipart images of hand-held tools.
"A tool is any physical item that can be used to achieve a goal, especially if the item is not consumed in the process. Informally the word is also used to describe a procedure or process with a specific purpose.
Tools that are used in particular fields or activities may have different designations such as "instrument", "utensil", "implement", "machine", or "apparatus". The set of tools needed to achieve a goal is "equipment". The knowledge of constructing, obtaining and using tools is technology." [Tool. Wikipedia]
The vector clip art library "Tools" is included in the Manufacturing and Maintenance solution from the Illustration area of ConceptDraw Solution Park.
Vector clip art
Electrical Symbols — Maintenance

Why People Select ConceptDraw MINDMAP

Circuits and Logic Diagram Software

"Causes in the diagram are often categorized, such as to the 6 M's ...
The 6 Ms (used in manufacturing industry):
(1) Machine (technology);
(2) Method (process);
(3) Material (Includes Raw Material, Consumables and Information.);
(4) Man Power (physical work)/ Mind Power (brain work): Kaizens, Suggestions;
(5) Measurement (Inspection);
(6) Milieu/ Mother Nature (Environment).
The original 6Ms used by the Toyota Production System have been expanded by some to include the following and are referred to as the 8Ms. However, this is not globally recognized. It has been suggested to return to the roots of the tools and to keep the teaching simple while recognizing the original intent; most programs do not address the 8Ms.
(7) Management/ Money Power;
(8) Maintenance." [Ishikawa diagram. Wikipedia]
This 8Ms Ishikawa diagram (manufacturing cause and effect diagram) template is included in the Fishbone Diagram solution from the Management area of ConceptDraw Solution Park.
8Ms Ishikawa diagram

Decision Making


How Do Fishbone Diagrams Solve Manufacturing Problems

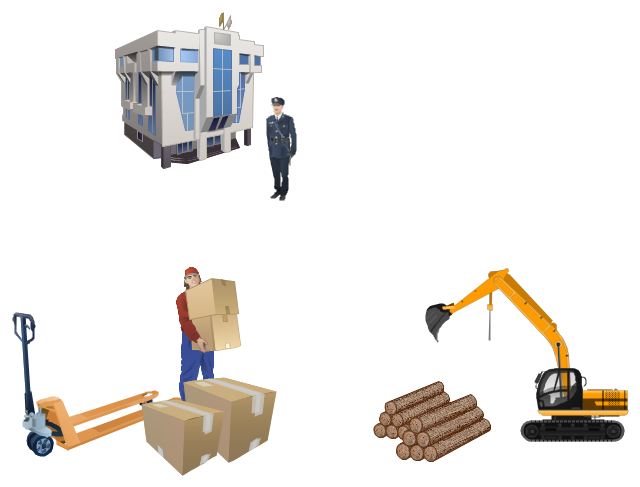
The vector illustration template "Manufacturing and Maintenance" opens the libraries of vector clipart: Packaging, loading, customs; Industrial vehicles; Tools; Resources and energy.
The vector illustration template "Manufacturing and Maintenance" for the ConceptDraw PRO diagramming and vector drawing software is included in the Manufacturing and Maintenance solution from the Illustration area of ConceptDraw Solution Park.
The vector illustration template "Manufacturing and Maintenance" for the ConceptDraw PRO diagramming and vector drawing software is included in the Manufacturing and Maintenance solution from the Illustration area of ConceptDraw Solution Park.
Vector illustration
Amazon Cloud

Network Diagramming Software for Network Active Directory Diagrams
")

ERD Symbols and Meanings


- Diagram Of Tools Used Maintenance Activities
- Tools - Vector stencils library | Diagram Of Screwdriver And Its ...
- Tools - Vector stencils library | Design elements - Tools | Uses Of ...
- Diagram Of Some Tools Used In Maintenance
- Examples Of Maintenance Tools
- Manufacturing and Maintenance | Design elements - Tools ...
- Diagram Of Tools In Maintenance
- Diagram Of Tools Of Maintenance And Repair
- Tools - Vector stencils library | Diagram Of Spade
- Tools Used In Fields
- Diagrams For Maintance Tools Of A Computer System
- Diagram Of Maintenance Tools
- Design elements - Tools | Computers and Communications ...
- Design elements - Tools | Tools - Vector stencils library | Cloud ...
- Tools - Vector stencils library | 7 tools that should be in every home ...
- Tools And Diagram In Maintenance
- Manufacturing Tools
- Diagrams Of Maintenance Instruments
- 7 tools that should be in every home
- Maintenance - Vector stencils library | Manufacturing and ...