This site uses cookies. By continuing to browse the ConceptDraw site you are agreeing to our Use of Site Cookies.

timeline diagram, timeline template Timeline Diagrams

timeline diagram, timeline template
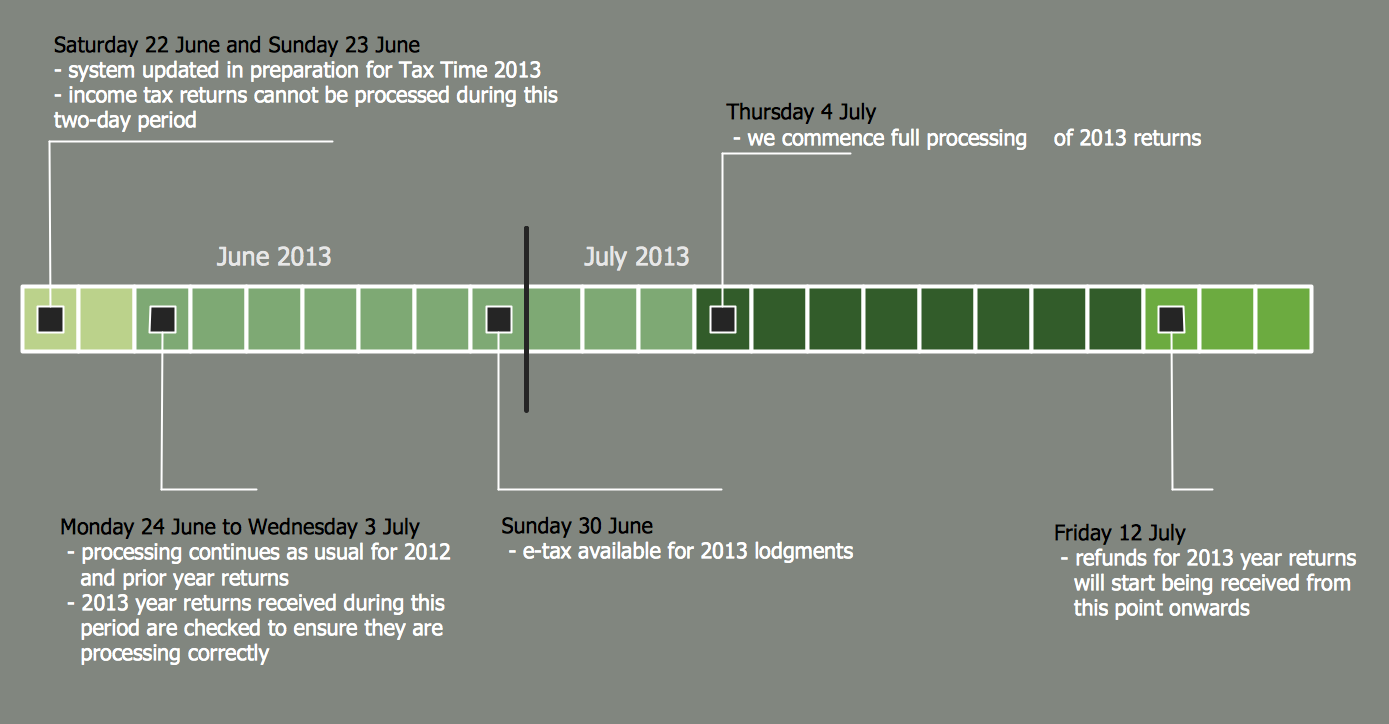
Timeline Diagrams solution extends ConceptDraw DIAGRAM diagramming software with samples, templates and libraries of specially developed smart vector design elements of timeline bars, time intervals, milestones, events, today marker, legend, and many other elements with custom properties, helpful for professional drawing clear and intuitive Timeline Diagrams. Use it to design simple Timeline Diagrams and designate only the main project stages, or highly detailed Timeline Diagrams depicting all project tasks, subtasks, milestones, deadlines, responsible persons and other description information, ideal for applying in presentations, reports, education materials, and other documentation.

Project Timeline

Project timeline is a type of chart which allows visually represent the chronology of works for the project, placing the key points of the project (milestones) on a timescale.
You need to make professional looking project timeline? Create it with ConceptDraw DIAGRAM! ConceptDraw DIAGRAM extended with Timeline Diagrams Solution from the Management Area is the best timeline diagrams software

Timeline Examples

ConceptDraw DIAGRAM diagramming and vector drawing software offers the Timeline Diagrams solution from the Management area which is rich for the timeline examples, samples, templates and ready-to-use vector shapes.

How to Make a Timeline

Timeline is a type of diagram which illustrates the series of events in a chronological order on a linear timescale. How to make a timeline? It is convenient to use a modern powerful software. ConceptDraw DIAGRAM diagramming and vector drawing software extended with Timeline Diagrams solution from the Management area is exactly what you need.

Area Charts, area graphs, visualize Basic Area Charts

Area Charts, area graphs, visualize
This solution extends the capabilities of ConceptDraw DIAGRAM (or later) with templates, samples and a library of vector stencils for drawing Area Charts (area graphs) that visualize changes in values by filling in the area beneath the line connecting data points.

Flowchart Software

Flowchart is widely used in business, education and economic presentations to help the audience visualize the content better, or to find flaws in a process flow diagrams. Flowcharts are particularly useful for displaying how a process currently flow or could ideally function. Flowcharts can help you see whether the steps of a process are logical, uncover problems or miscommunications, define the boundaries of a process, and develop a common base of knowledge about a process.

ConceptDraw DIAGRAM flowchart software will help to quickly create new flowcharts, workflow, NS Diagram, BPMN Diagram, Cross-functional flowcharts, data flow diagrams and highlight flowcharts.

Feature-rich flowchart maker, free thousand flowchart examples and templates and colored symbols that will allow you to create professional looking flowcharts simply.

ConceptDraw DIAGRAM supports macOS and Windows.
How to Build a Flowchart

logistics management Logistic Dashboard

logistics management
The powerful tools of Logistic Dashboard solution and specially developed live graphic objects of logistic icons, logistic navigation elements, logistic indicators, logistic charts and logistic maps effectively assist in designing Logistic dashboards, Logistic maps, Logistic charts, diagrams and infographics. The included set of prebuilt samples and quick-start templates, demonstrates the power of ConceptDraw DIAGRAM software in logistics management, its assisting abilities in development, realization and analyzing the logistic processes, as well as in perfection the methods of logistics management.

enterprise architecture diagram, business architecture Enterprise Architecture Diagrams

enterprise architecture diagram, business architecture
Enterprise Architecture Diagrams solution extends ConceptDraw DIAGRAM software with templates, samples and library of vector stencils for drawing the diagrams of enterprise architecture models.

Business diagrams & Org Charts with ConceptDraw DIAGRAM

Business flowcharting tool helps you create a flowchart with minimal effort. With ConceptDraw you can make a flowchart, draw data flow diagrams, orgchart professional, process flow diagrams etc - without any prior knowledge or training.
Draw Business Process Diagrams

Timeline Diagrams

Timeline is a powerful tool for project management and project scheduling, it is a convenient way to represent a chronological sequence of events and critical milestones along a time axis. Timeline allows quickly understand the temporal relationships and to see the progress of a project schedule.
ConceptDraw DIAGRAM extended with Timeline Diagrams solution from the Management area of ConceptDraw Solution Park is a powerful software for fast and easy drawing useful and great-looking timeline diagrams.