This site uses cookies. By continuing to browse the ConceptDraw site you are agreeing to our Use of Site Cookies.

Work Flow Process Chart

Workflow Diagram - workflow process diagram is a visual representation of a organizational process flow. Often it used as the same visual notation as process flow diagram. Visualising business processes using workflow diagram (workflow process diagram) allows estimate business process efficiency, analyse and optimize the process itself. Workflow diagram helps get focusing on each step and relations between workflow steps. ConceptDraw DIAGRAM is software for making workflow diagram. It contains specific designed graphics to draw workflow diagrams effectively. This is workflow diagram maker which do your work process effective.

Flow Chart Symbols

ConceptDraw DIAGRAM software extended with Flowcharts Solution from the "Diagrams" Area is a powerful software that will help you design the flowcharts for any business and technical processes, and software algorithms thanks to the predesigned flow chart symbols. Flowcharts solution offers 2 libraries with large collection of vector flow chart symbols: Flowchart Library, Flowcharts Rapid Draw Library that you can use to create your flowcharts quick and easy. Flowchart Solution is number of diagraming stencils including special set of flow chart symbols such as: terminator, process, decision which indicates a decision points between two or more paths in a flowchart, symbol of delay. Major symbols includes symbol of data, document or multiple documents, subroutine, preparation for processing of documents. Also includes symbols: display, manual input, manual loop, loop limit, stored data,connectors and suming junctions, sort and merge operations, symbols of database and internal stor

Process Flow Chart

A Process Flow Chart is a type of flowchart which is mostly used in industrial, chemical and process engineering for illustrating high-level processes, major plant processes and not shows minor details.
ConceptDraw DIAGRAM diagramming and vector drawing software extended with Flowcharts Solution from the "Diagrams" Area of ConceptDraw Solution Park is the best way to create Process Flow Chart and other types of flowcharts.

Processing Flow Chart

Processing Flow Chart is a simplified sketch which is used in chemical and process engineering for illustrating general plant streams, major equipments and key control loops.

ConceptDraw DIAGRAM enhanced with Flowcharts Solution from the "Diagrams" Area of ConceptDraw Solution Park is a powerful Processing Flow Chart software which will help save lots of your time.

Modelling Complex Events with Event-Driven Process chain

Event-Driven Process Chain Diagrams for improvement throughout an organisation.
ConceptDraw DIAGRAM - software that reduces the time needed to create a business process model.

Flow chart Example. Warehouse Flowchart

Warehouse Flowcharts are different diagrams describing wharehousing and inventory menagement processes. Typical purposes of warehouse flowcharts are evaluating warehouse performance and organizational performance, measuring efficiency of customer service. This type of workflow diagrams can be used for identifying any disconnection between business activities and business objectives.
Standard warehousing process flow diagram and standard workflow diagram used for process identification for further evaluating effectiveness and profitability of overall business process. Use the ConceptDraw DIAGRAM diagramming and vector drawing software extended with the Flowcharts solution from the Diagrams area of ConceptDraw Solution Park to design your own workflow diagrams, process flow diagram and flow charts. Need to use Process Flow Diagram for designing Warehouse packages flow.
ConceptDraw Arrows10 Technology

Business Process Flowchart

Cross-functional (deployment) flowcharts visualize what functional units (people, departments or functional areas) are responsible for the business process operations.
The flowcharts are divided into rows/columns of functional units. Blocks of various shapes represent the process steps, and are placed in rows/columns of the responsible functional units.

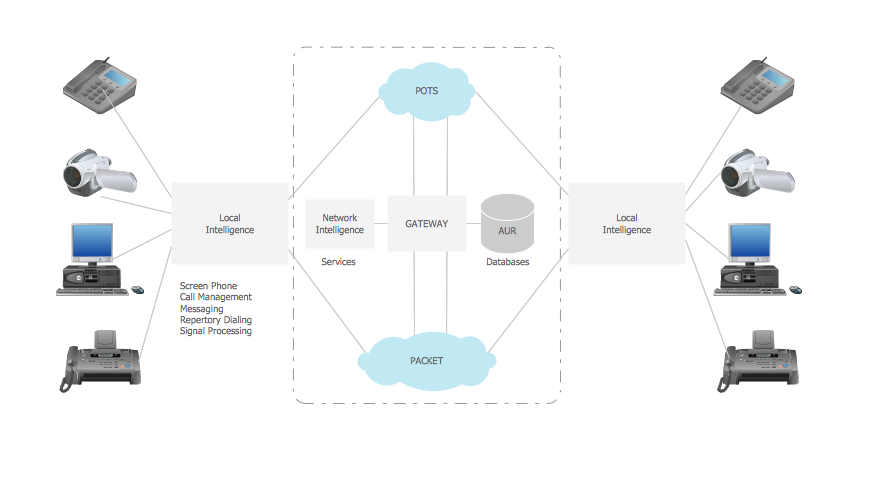
Telecommunication networks. Computer and Network Examples

A Telecommunications network is a network of nodes, links, trunks and telephone switches that are connected, operated by telephone companies and realize telephone, audio, visual and data communications among the users. The telecommunications network can also include Internet, microwave, wireless equipment.
This example was created in ConceptDraw DIAGRAM using the Computer and Networks Area of ConceptDraw Solution Park and shows the Telecommunications network.

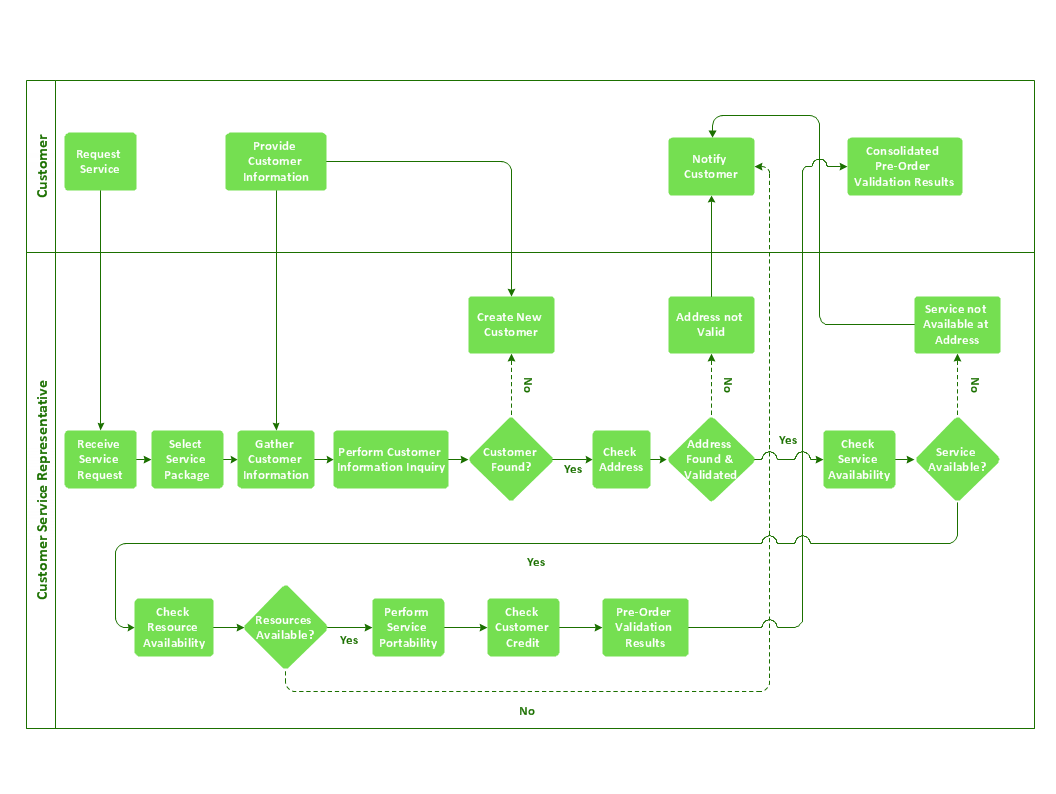
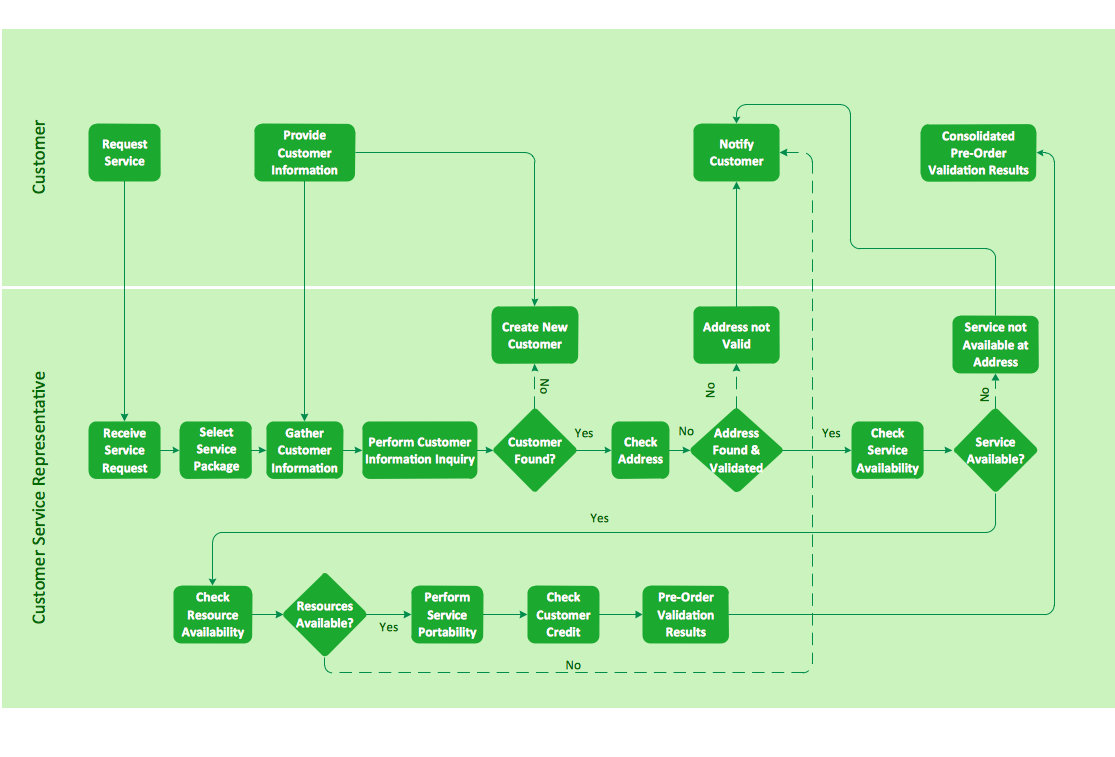
Cross-functional flowchart landscape, U.S. units

In Cross-Functional Flowchart first step is to determine how many lanes you want to represent and what the lane titles will be. The choice of vertical or horizontal swim lanes landscape comes down to personal choice or just plain “what fits best”.

With ConceptDraw, we make that simple by including different swim lanes templates.
Professional looking examples and templates of Swimlane Flowchart which help you create Cross Functional Flowcharts rapidly.

Business diagrams & Org Charts with ConceptDraw DIAGRAM

Business flowcharting tool helps you create a flowchart with minimal effort. With ConceptDraw you can make a flowchart, draw data flow diagrams, orgchart professional, process flow diagrams etc - without any prior knowledge or training.
Draw Business Process Diagrams