This circular arrows diagram sample shows the systems development life cycle (SDLC) stages.
"The systems development life cycle (SDLC), also referred to as the application development life-cycle, is a term used in systems engineering, information systems and software engineering to describe a process for planning, creating, testing, and deploying an information system. The systems development life-cycle concept applies to a range of hardware and software configurations, as a system can be composed of hardware only, software only, or a combination of both." [Systems development life-cycle. Wikipedia]
The arrow circle diagram example "Systems development life cycle" was created using the ConceptDraw PRO diagramming and vector drawing software extended with the Circular Arrows Diagrams solution from the area "What is a Diagram" of ConceptDraw Solution Park.
Circular arrows diagram

Data Flow Diagram (DFD)
")
Data Flow Diagram Model

This hotel computer reservations system cycle process chart example was redesigned from the Wikimedia Commons file: По-запросу.jpg.
[commons.wikimedia.org/ wiki/ File:По-запросу.jpg]
"A computer reservations system or central reservation system (CRS) is a computerized system used to store and retrieve information and conduct transactions related to air travel, hotels, car rental, or activities. ...
Modern GDSes typically allow users to book hotel rooms, rental cars, airline tickets as well as activities and tours." [en.wikipedia.org/ wiki/ Computer_ reservations_ system]
The cycle process diagram example "Hotel reservation system" was created using the ConceptDraw PRO diagramming and vector drawing software extended with the Sales Flowcharts solution from the Marketing area of ConceptDraw Solution Park.
Hotel computer reservation system - Cycle process diagram

UML Use Case Diagram Example Registration System

UML Class Diagram Example for GoodsTransportation System

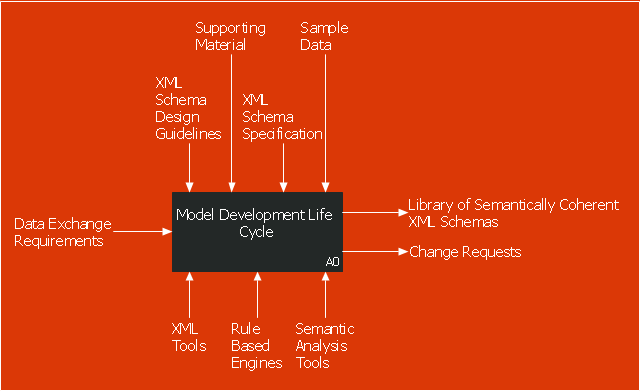
This IDEF0 diagram sample was created on the base of the figure from the website of the Engineering Laboratory of the National Institute of Standards and Technology (NIST). [mel.nist.gov/ msidlibrary/ doc/ kc_ morris/ gsa-final_ files/ image002.gif]
"The systems development life cycle (SDLC), also referred to as the application development life-cycle, is a term used in systems engineering, information systems and software engineering to describe a process for planning, creating, testing, and deploying an information system. The systems development life-cycle concept applies to a range of hardware and software configurations, as a system can be composed of hardware only, software only, or a combination of both." [Systems development life cycle. Wikipedia]
The IDEF0 diagram example "Model development life cycle" was created using the ConceptDraw PRO diagramming and vector drawing software extended with the IDEF0 Diagrams solution from the Software Development area of ConceptDraw Solution Park.
IDEF0 diagram
Identifying Quality Management System

Structured Systems Analysis and Design Method (SSADM) with ConceptDraw PRO

Flowchart Components

- Systems development life cycle
- Systems development life cycle | SSADM Diagram | Process ...
- Draw The Diagram Of The System Development Cycle
- Systems development life cycle | Block Diagrams | Circular Arrows ...
- DFD - Process of account receivable | Data structure diagram with ...
- Systems development life cycle | Circular Arrows Diagrams | Data ...
- DFD - Process of account receivable | Circular Arrows Diagrams ...
- Examples Of System Development Life Cycle Flow Chart
- Systems development life cycle | Circular Arrows Diagrams | Circular ...
- Cycle Diagram Software