Accounting Data Flow from the Accounting Flowcharts Solution

Flowchart Examples and Templates

Flowchart of Products. Flowchart Examples

 Healthcare Management Workflow Diagrams
Healthcare Management Workflow Diagrams solution contains large set of colorful samples and libraries with predesigned vector pictograms and symbols of health, healthcare equipment, medical instruments, pharmaceutical tools, transport, medication, departments of healthcare organizations, the medical icons of people and human anatomy, as well as the predesigned flowchart objects, connectors and arrows, which make it the best for designing clear and comprehensive Medi?al Workflow Diagrams and Block Diagrams, Healthcare Management Flowcharts and Infographics, Healthcare Workflow Diagram, for depicting the healthcare workflow and clinical workflows in healthcare, for making the workflow analysis healthcare and healthcare workflow management.
Business Process Reengineering Examples
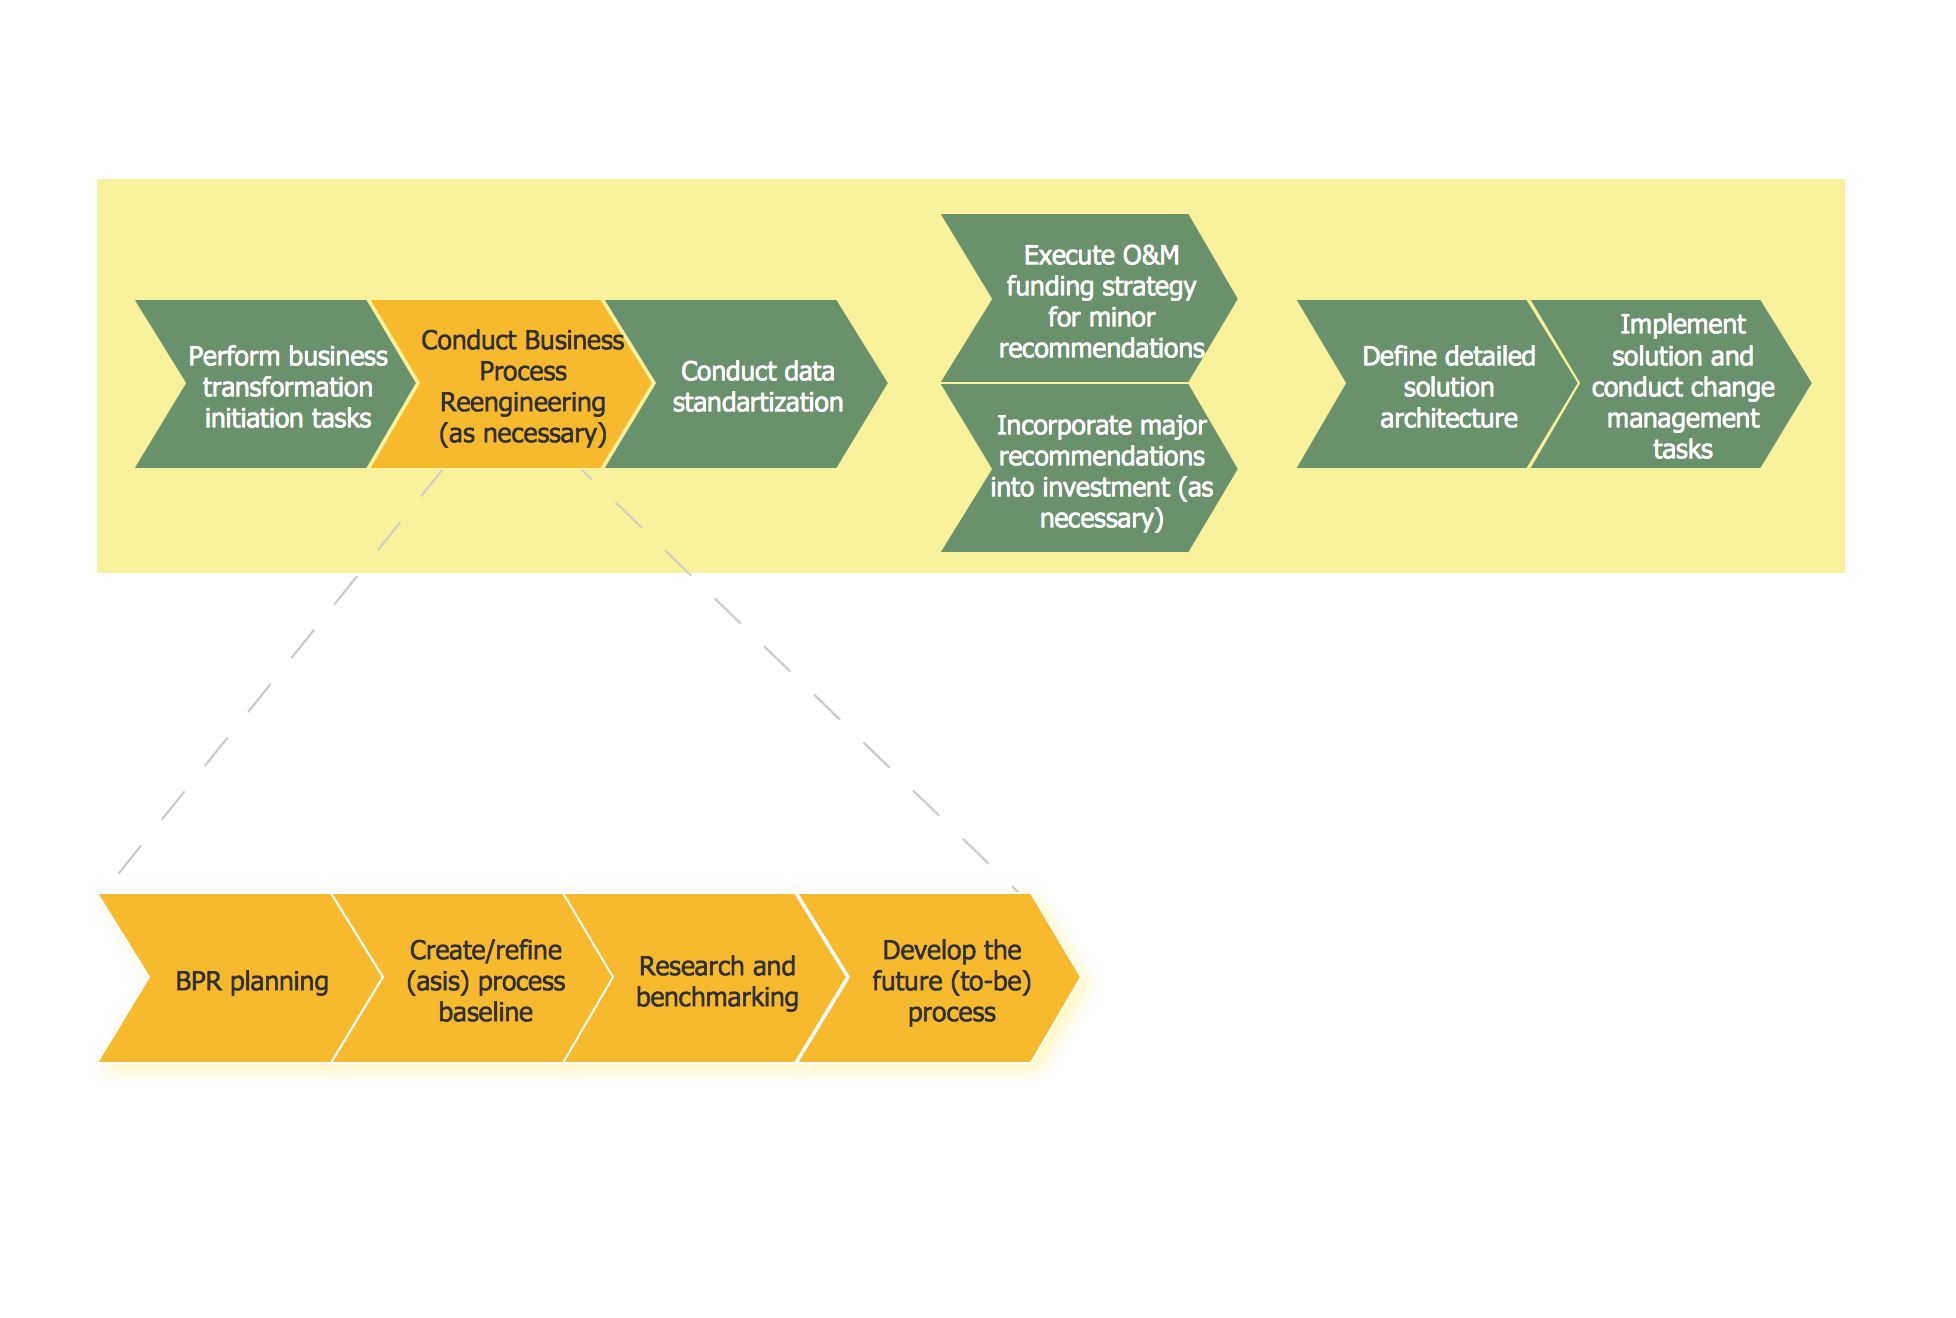
 Business Process Mapping
The Business Process Mapping solution for ConceptDraw DIAGRAM is for users involved in process mapping and creating SIPOC diagrams.
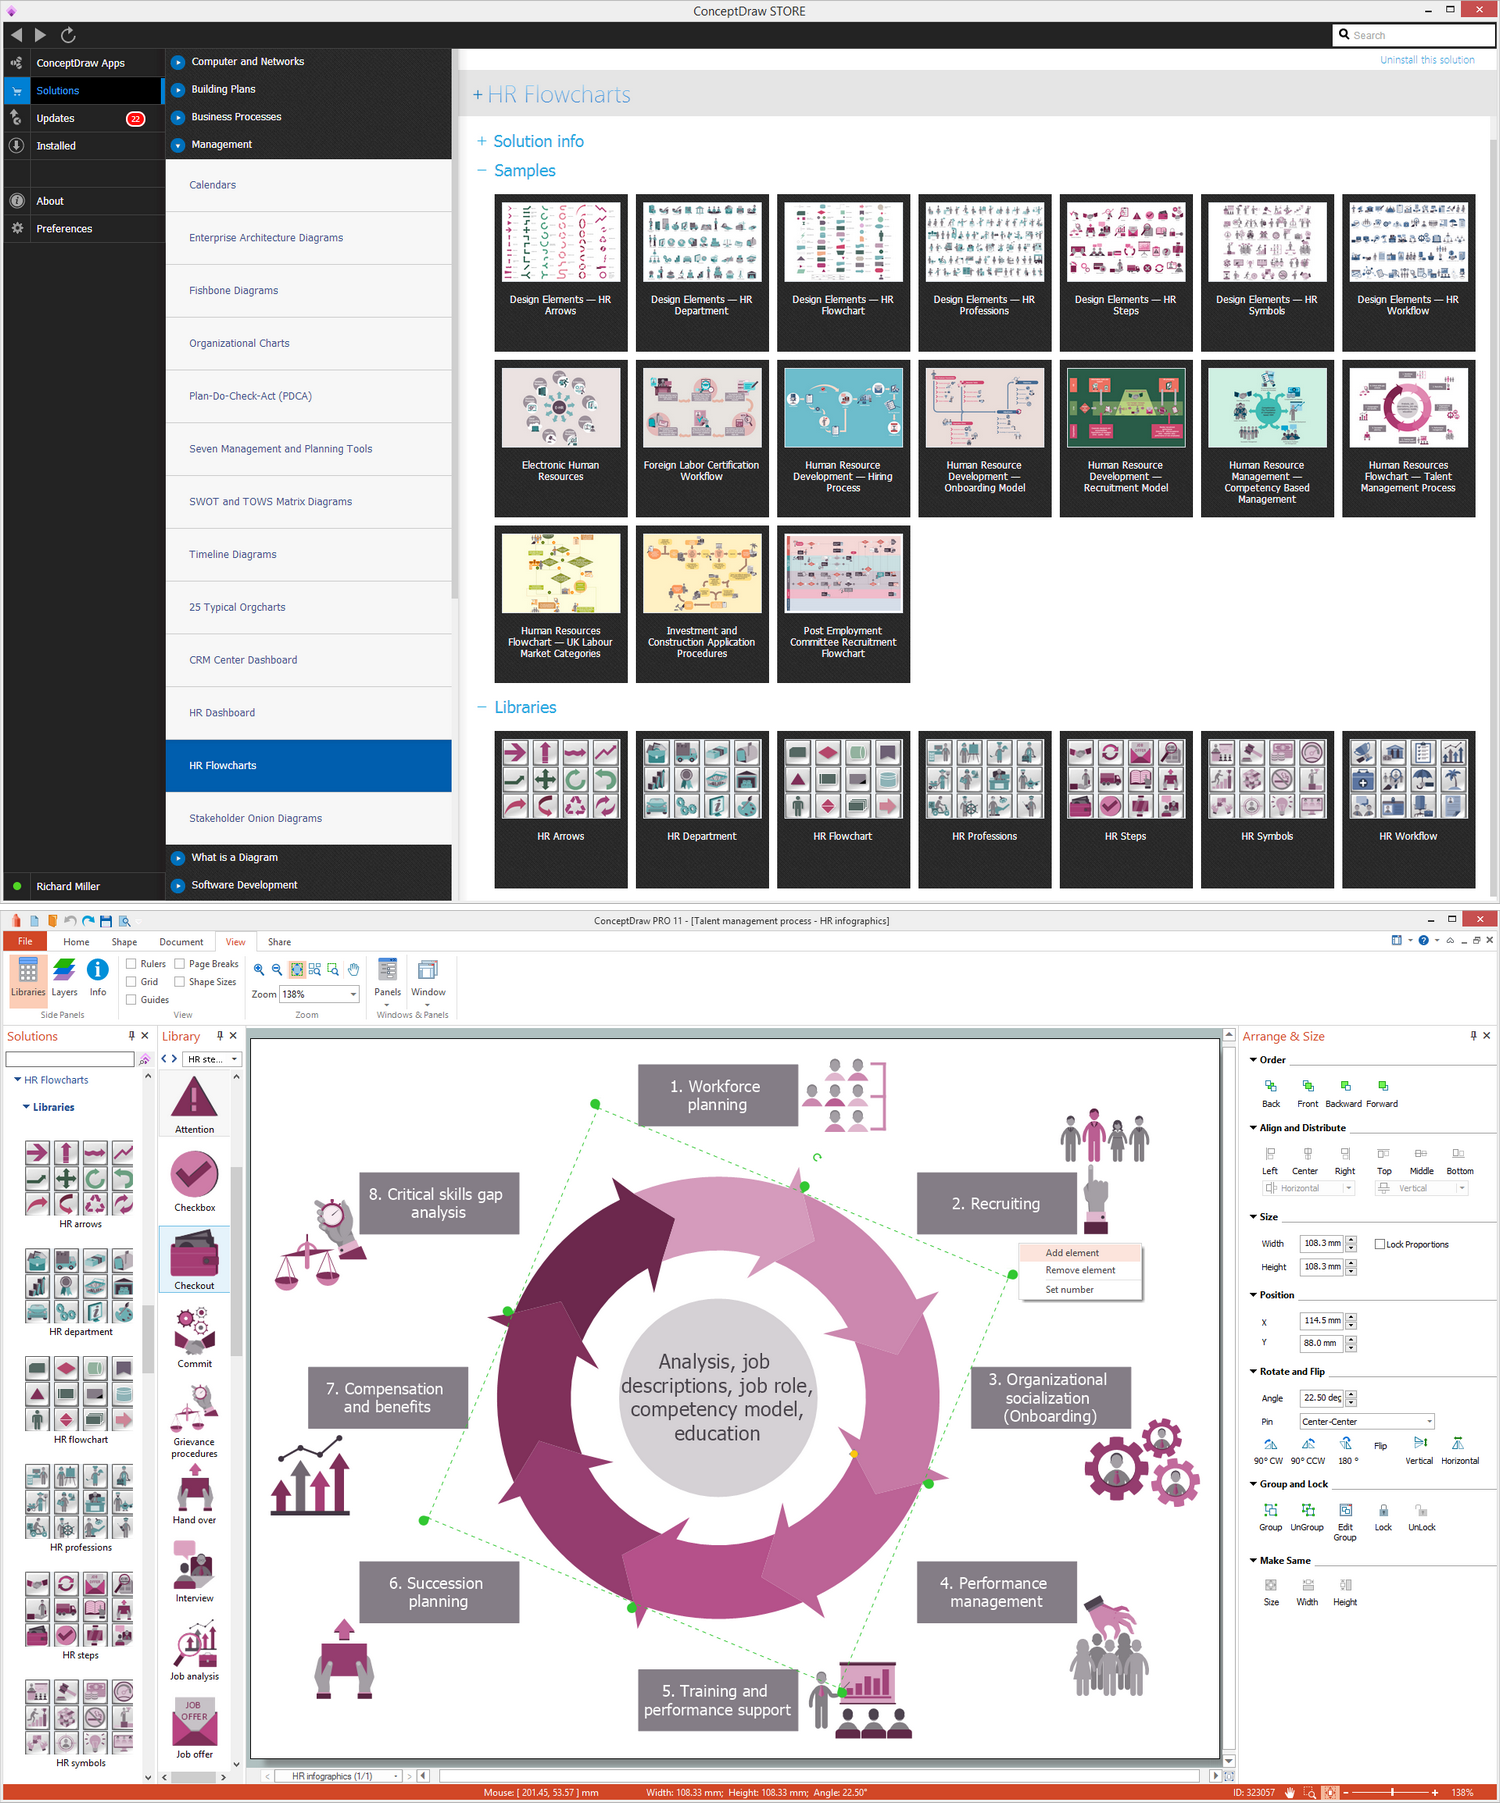
Human Resources
Biology Drawing

This circular motion diagram sample was created on the base of the figure illustrating the article "Collaboration 2.0" from the HLWIKI International website. "Collaboration is an activity where individuals are motivated to work together in order to achieve certain mutually-desirable, articulated and achievable goals. In the digital age, collaboration 2.0 combines various aspects of web 2.0 and social media with the principles of collaboration. Some critical or typical features of collaboration 2.0 should include:
(1) synchronous collaboration via social calendaring, online meeting software and instant messaging tools,
(2) asynchronous collaboration made possible via shared workspaces and annotation capabilities.
A new form of collaboration is called collaborative information seeking which Wikipedia defines as "... a field of research that involves studying situations, motivations, and methods for people working in collaborative groups for information seeking projects, as well as building systems for supporting such activities. Such projects often involve information searching or information retrieval (IR), information gathering, and information sharing. Beyond that, CIS can extend to collaborative information synthesis and collaborative sense-making." " [hlwiki.slais.ubc.ca/ index.php/ Collaboration_ 2.0]
This file is available under a Creative Commons Attribution-NonCommercial-ShareAlike 2.5 Generic Licence. [creativecommons.org/ licenses/ by-nc-sa/ 2.5/ ]
The circular arrow diagram example "Collaboration life-cycle" was created using the ConceptDraw PRO diagramming and vector drawing software extended with the Target and Circular Diagrams solution from the Marketing area of ConceptDraw Solution Park.
www.conceptdraw.com/ solution-park/ marketing-target-and-circular-diagrams
Circular motion diagram
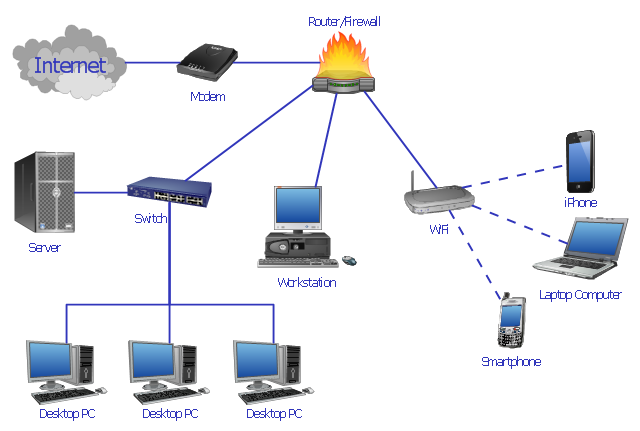
"Network planning and design is an iterative process, encompassing topological design, network-synthesis, and network-realization, and is aimed at ensuring that a new telecommunications network or service meets the needs of the subscriber and operator. Network planning process involves three main steps: 1) Topological design: This stage involves determining where to place the components and how to connect them. 2) Network-synthesis: This stage involves determining the size of the components used, subject to performance criteria such as the Grade of Service (GoS). 3) Network realization: This stage involves determining how to meet capacity requirements, and ensure reliability within the network." [Network planning and design. Wikipedia]
This computer network system design diagram example was created using the ConceptDraw PRO diagramming and vector drawing software extended with the Computer and Networks solution from the Computer and Networks area of ConceptDraw Solution Park.
This computer network system design diagram example was created using the ConceptDraw PRO diagramming and vector drawing software extended with the Computer and Networks solution from the Computer and Networks area of ConceptDraw Solution Park.
Network system design
- System Design
- Flow Chart The Simple Computer Network Systems
- Computer network system design diagram | Structured Systems ...
- Flowchart Definition | Types of Flowcharts | Matrix Organization ...
- IDEF0 standard with ConceptDraw PRO | IDEF0 Diagrams | IDEF0 ...
- IDEF0 standard with ConceptDraw PRO | IDEF0 Diagrams | IDEF0 ...
- Research cycle - Circle diagram | Innovation life cycle - Arrow loop ...
- IDEF0 standard with ConceptDraw DIAGRAM | IDEF0 Diagrams ...
- IDEF0 Diagrams | IDEF Business Process Diagrams | Application ...
- IDEF0 standard with ConceptDraw PRO | IDEF0 Diagram | IDEF0 ...