HelpDesk
How to Create a Data Flow Diagram using ConceptDraw PRO
Data flow diagramming is a highly effective technique for showing the flow of information through a system. Data flow diagrams reveal relationships among and between the various components in a program or system. DFD is an important technique for modeling a system’s high-level detail by showing how input data is transformed to output results through a sequence of functional transformations. The set of standard symbols is used to depict how these components interact in a system. ConceptDraw PRO allows you to draw a simple and clear Data Flow Diagram using special libraries.
 Flowcharts
The Flowcharts Solution for ConceptDraw PRO v10 is a comprehensive set of examples and samples in several different color themes for professionals that need to graphically represent a process. Solution value is added by basic flow chart template and shapes' library of Flowchart notation. ConceptDraw PRO flow chart creator lets one depict a processes of any complexity and length, as well design of the flowchart either vertically or horizontally.
HelpDesk
Event-driven Process Chain (EPC) Diagram Software
An EPC diagram is a type of flowchart used in business process analysis. It shows different business processes through various work flows. The workflows are shown as processes and events that are related to different executes and tasks that allow business workflow to be completed. An EPC diagram shows different business processes through various workflows. The workflows are seen as functions and events that are connected by different teams or people, as well as tasks that allow business processes to be executed. The best thing about this type of enterprise modelling is that creating an EPC diagram is quick and simple as long as you have the proper tool. One of the main usages of the EPC diagrams is in the modelling, analyzing and re-engineering of business processes. With the use of the flowchart, businesses are able to see inefficiencies in the processes and modify to make them more productive. Event-driven process chain diagrams are also used to configure an enterprise resource plaHelpDesk
How to Create an Accounting Flowchart Using ConceptDraw Solution Park
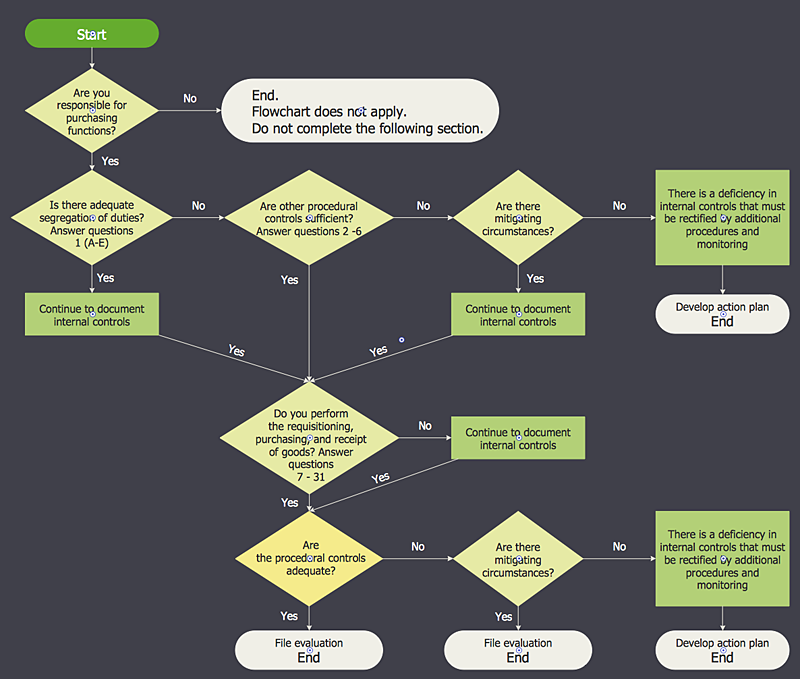
An Accounting flowchart is a specialized type of flowchart. With the help of an accounting flowchart you can visually describe tasks, documents, people responsible for execution at each stage of accounting workflow. Find out how you can easily create an accounting flowchart of any complexity using Accounting Flowchart Solution from the ConceptDraw Solution Park.- Euclidean algorithm - Flowchart | Basic Flowchart Symbols and ...
- Flowchart design. Flowchart symbols , shapes, stencils and icons ...
- Basic Flowchart Symbols and Meaning | Flowchart | Product ...
- Data Flow Diagram Symbols . DFD Library | Basic Flowchart ...
- Basic Flowchart Symbols and Meaning | Flowchart design ...
- Basic Flowchart Symbols and Meaning | Data Flow Diagram ...
- The Specific Flowchart Symbols Data
- Basic Flowchart Symbols and Meaning | Flowchart design ...
- Algorithms And Data Flow Chart
- Design elements - Data Flow Diagram (DFD) | How to Create ...
- Basic Flowchart Symbols and Meaning | Data Flow Diagram ...
- Flow chart Example. Warehouse Flowchart | Basic Flowchart ...
- Basic Flowchart Symbols and Meaning | How to Create Flowchart ...
- Process Flowchart | Basic Flowchart Symbols and Meaning ...
- Basic Flowchart Symbols and Meaning | Audit Flowchart Symbols ...
- Basic Flowchart Symbols | Sales Process Flowchart . Flowchart ...
- Flowcharts | Cross-Functional Process Map Template | Data Flow ...
- Cross-Functional Flowchart | Basic Flowchart Symbols and Meaning ...
- Database Flowchart Symbols | Data Flow Diagram Symbols . DFD ...
- Flowchart design. Flowchart symbols , shapes, stencils and icons ...


