HelpDesk
How to Create SWOT Analysis Template

How to Make SWOT Analysis in a Word Document

HelpDesk
How to Make SWOT Analysis in a Word Document

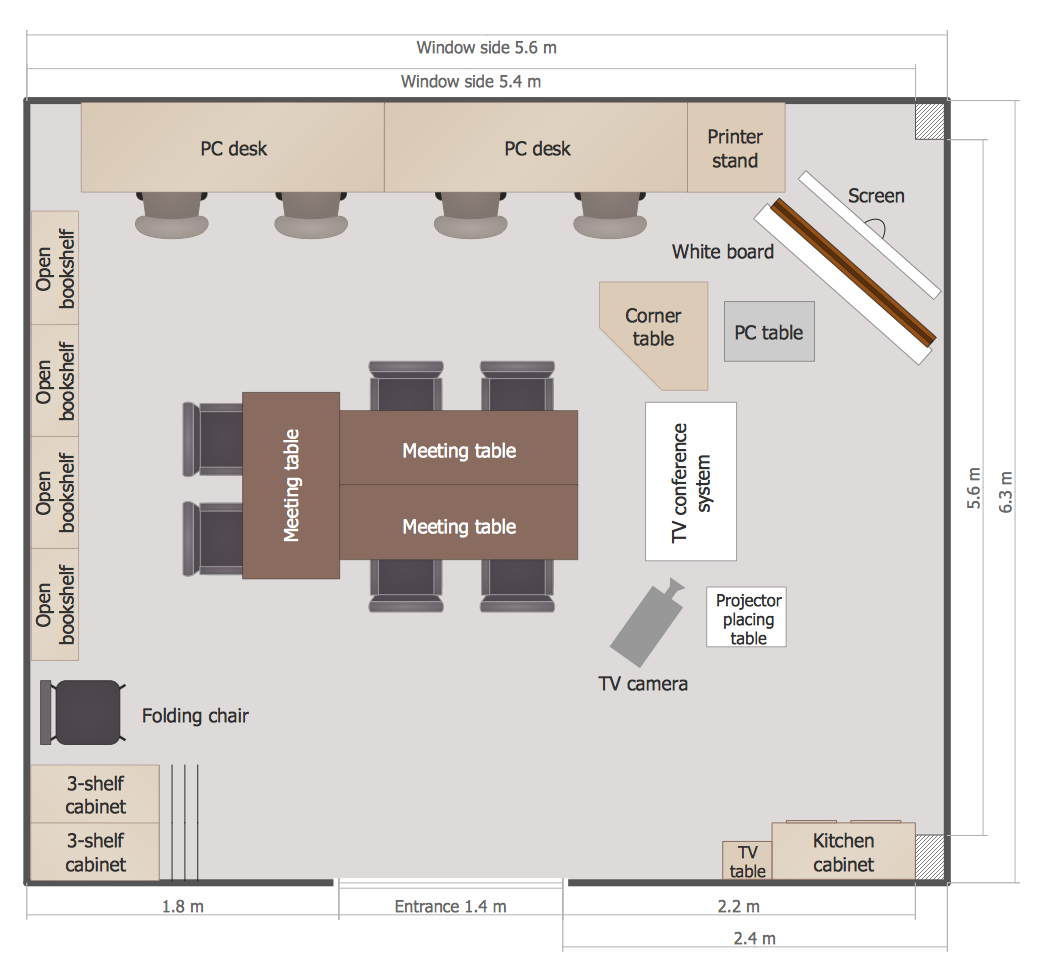
 Seating Plans
The Seating Plans solution including samples, seating chart templates and libraries of vector design elements assists in creating the Seating plans, Seating arrangement charts, Chair layout designs, Plan drawings of cinema seating, Movie theater chair plans, extensive Cinema theater plans depicting the seating arrangement in the cinema halls, location of closet, cafe and food sale area, in designing the Seating plans for the large seating areas, Seat plan designs for airplanes, trains, etc. Use any of the included samples as the table seating chart template or seating chart template free and achieve professional drawing results in a few minutes.
HelpDesk
How to Draw a Scatter Diagram

HelpDesk
How to Add and Edit Connector Text

HelpDesk
How to Draw a Pictorial Chart

HelpDesk
How to Draw a Pareto Chart

HelpDesk
How to Create a Typography Infographic

HelpDesk
How to Create a Sales Dashboard

 ConceptDraw Solution Park
ConceptDraw Solution Park collects graphic extensions, examples and learning materials
 PM Easy
PM Easy solution extends the ConceptDraw PROJECT functionality with an ability to support neutral methodology of project management and to quickly start a project by listing the task relationships and dependencies, that makes the iterative planning much easier. The project management tool and available visual tools, such as mind mapping, increase the effectiveness of tracking and analysis your project tasks. PM Easy solution from ConceptDraw Solution Park is mainly targeted at project managers in small or medium-sized companies, allowing them to make the project plan and execute projects using mind mapping technique, to implement planning using mind mapping, and to track tasks using ConceptDraw PROJECT application.
HelpDesk
How to Create a Floor Plan for the Classroom
 Status Dashboard
Status dashboard solution extends ConceptDraw DIAGRAM software with templates, samples and vector stencils libraries with graphic indicators for drawing the visual dashboards showing status data.
 Entity-Relationship Diagram (ERD)
Entity-Relationship Diagram (ERD) solution extends ConceptDraw DIAGRAM software with templates, samples and libraries of vector stencils from drawing the ER-diagrams by Chen's and crow’s foot notations.
 Chemistry
This solution extends ConceptDraw DIAGRAM software with samples, template and libraries of vector stencils for drawing the Chemistry Illustrations for science and education.
- SWOT analysis matrix
- SWOT analysis Software & Template for Macintosh and Windows ...
- Marketing | PM Agile | Comparison Dashboard | Comparison Table ...
- SWOT Analysis | SWOT Analysis Solution - Strategy Tools | SWOT ...
- SWOT Matrix Template
- SWOT Analysis Solution - Strategy Tools | SWOT and TOWS Matrix ...
- Four-quadrant matrix template | New business opportunity SWOT ...
- Porter's value chain diagram template | Design elements - Matrices ...
- SWOT Analysis | New business opportunity SWOT analysis matrix ...
- SWOT Matrix Template | SWOT Analysis | SWOT analysis matrix
- Swot Analysis Examples | SWOT analysis matrix diagram templates ...
- Marketing | SWOT analysis matrix diagram templates | Comparison ...
- Social strategy pyramid - Marketing diagram | Four-quadrant matrix ...
- Porter's value chain matrix diagram | Mind Maps for Business ...
- Competitive strategy matrix template | SWOT Analysis Solution ...
- Boston growth-share (BCG) matrix diagram | Matrices | SWOT matrix ...
- How to Create a PowerPoint Presentation from a SWOT Analysis ...
- Small business consultancy SWOT analysis matrix | SWOT analysis ...
- Ansoff product/market growth matrix - Positioning matrix | Scale of ...
- Swot Analysis Examples