SWOT Analysis Solution - Strategy Tools

"SWOT analysis is a classic strategic planning tool. Using a framework of internal strengths and weaknesses and external opportunities and threats, it provides a simple way to assess how a strategy can best be implemented. The tool helps planners be realistic about what they can achieve, and where they should focus. ...
The SWOT framework - a two-by-two matrix - is best completed in a group with key members of the team or organisation present. First it is important to be clear what the policy change objective is, and what team or organisation the analysis is being carried out on. Once these are clarified and agreed, begin with a brainstorm of ideas, and then hone them down and clarify them afterwards in discussion.
An assessment of internal capacity helps identify where the project or organisation is now: the existing resources that can be used immediately and current problems that won't go away. It can help identify where new resources, skills or allies will be needed. When thinking of strengths it is useful to think of real examples of success to ground and clarify the conversation. ...
An assessment of the external environment tends to focus on what is going on outside the organisation, or areas which are not yet affecting the strategy but could do - either positively or negatively." [odi.org.uk/ publications/ 5876-swot-analysis-context-mapping]
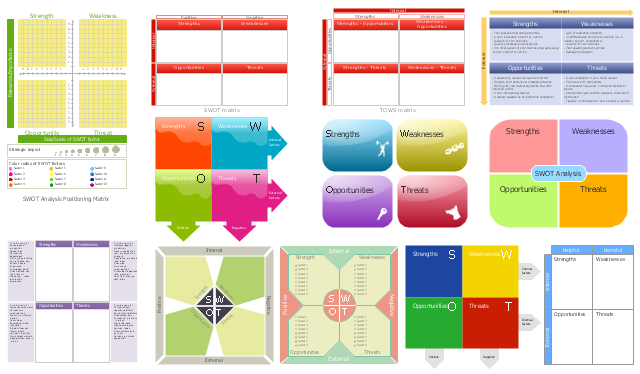
The vector stencils library "SWOT" contains 16 SWOT and TOWS matrix diagram templates for the ConceptDraw PRO diagramming and vector drawing software.
The example "Design elements - SWOT and TOWS analysis matrices" is included in the SWOT Analysis solution from the Management area of ConceptDraw Solution Park.
The SWOT framework - a two-by-two matrix - is best completed in a group with key members of the team or organisation present. First it is important to be clear what the policy change objective is, and what team or organisation the analysis is being carried out on. Once these are clarified and agreed, begin with a brainstorm of ideas, and then hone them down and clarify them afterwards in discussion.
An assessment of internal capacity helps identify where the project or organisation is now: the existing resources that can be used immediately and current problems that won't go away. It can help identify where new resources, skills or allies will be needed. When thinking of strengths it is useful to think of real examples of success to ground and clarify the conversation. ...
An assessment of the external environment tends to focus on what is going on outside the organisation, or areas which are not yet affecting the strategy but could do - either positively or negatively." [odi.org.uk/ publications/ 5876-swot-analysis-context-mapping]
The vector stencils library "SWOT" contains 16 SWOT and TOWS matrix diagram templates for the ConceptDraw PRO diagramming and vector drawing software.
The example "Design elements - SWOT and TOWS analysis matrices" is included in the SWOT Analysis solution from the Management area of ConceptDraw Solution Park.
SWOT and TOWS matrices
 SWOT Analysis
SWOT and TOWS Matrix Diagrams solution extends ConceptDraw DIAGRAM and ConceptDraw MINDMAP software with features, templates, samples and libraries of vector stencils for drawing SWOT and TOWS analysis matrices and mind maps.
HelpDesk
How to Make SWOT Analysis in a Word Document

HelpDesk
How to Perform a Presentation on Mac Using Two Monitors

HelpDesk
How to Set Line Jumps for Smart Connectors in ConceptDraw DIAGRAM

 ConceptDraw Solution Park
ConceptDraw Solution Park collects graphic extensions, examples and learning materials
HelpDesk
How to Edit Drawing Using Shadow

HelpDesk
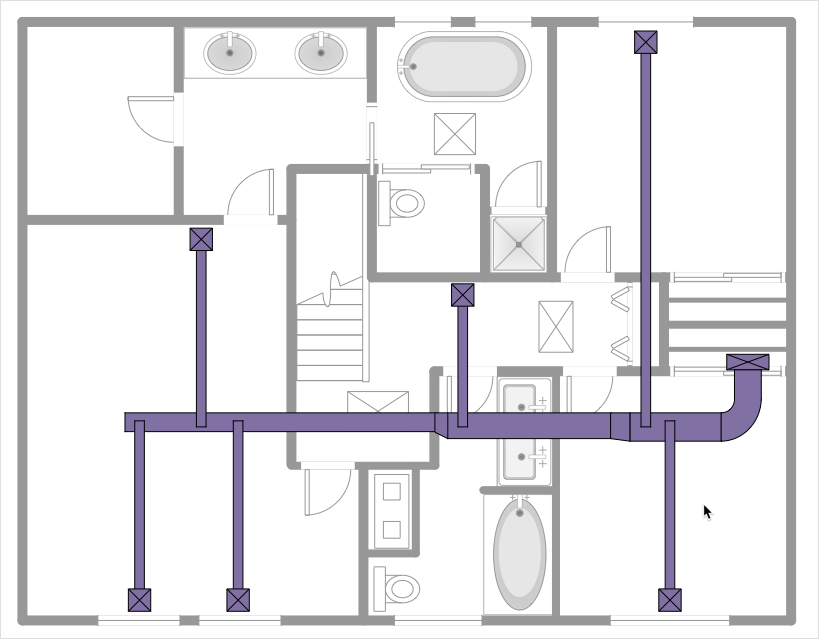
How to Create a HVAC Plan
HelpDesk
How to Draw a Gantt Chart

HelpDesk
How to Create a Concept Map

HelpDesk
How to Create Multipage Diagram From a Single Page Template
HelpDesk
How to Draw an Area Chart

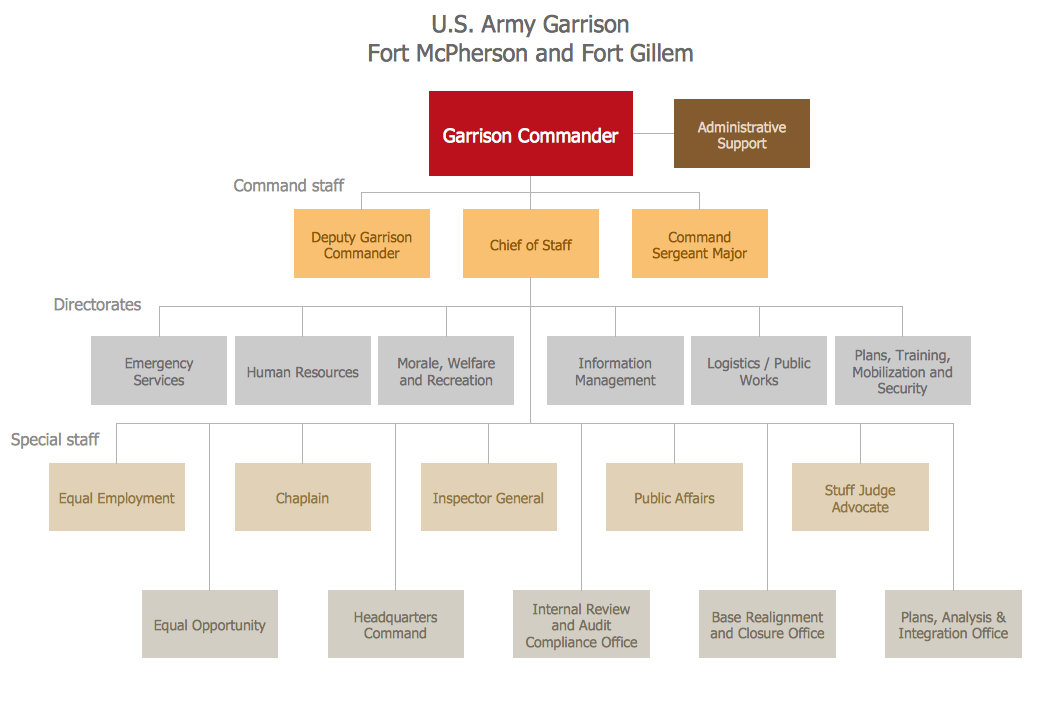
Organization Chart
HelpDesk
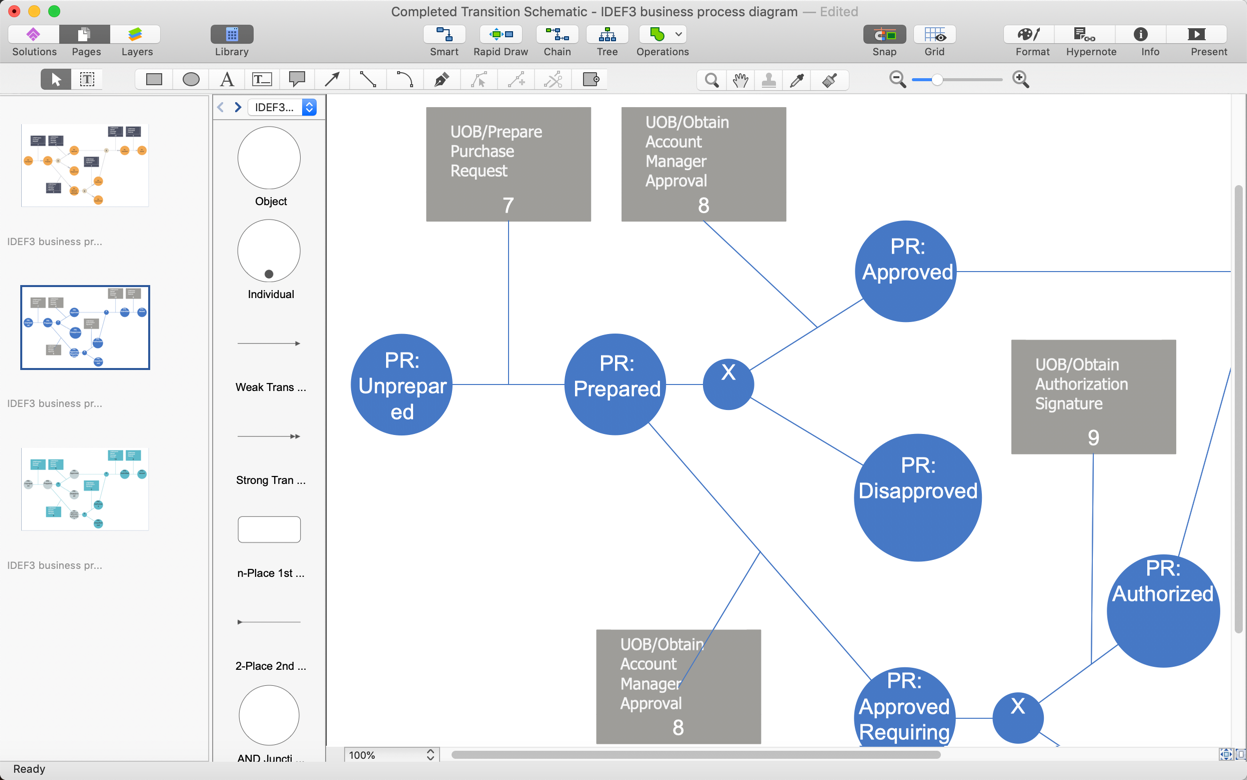
How to Add a Workflow Diagram to a PowerPoint Presentation
HelpDesk
How to Add a Concept Map to a PowerPoint Presentation

HelpDesk
How to Draw a Scatter Diagram

HelpDesk
How to Draw a Line Chart Quickly

- Swot Dan Twos
- Examples Of Swot And Twos Analysis Matrix
- SWOT Analysis Solution - Strategy Tools | TOWS analysis matrix ...
- SWOT Analysis | Block diagram - Porter's five forces model | SWOT ...
- Swot Template For Two Objects
- SWOT Matrix Template | SWOT Analysis | SWOT analysis for a small ...
- Authority Matrix Diagram Software | Porter's value chain matrix ...
- Design elements - SWOT and TOWS analysis matrices | New ...
- SWOT Analysis Solution - Strategy Tools | SWOT and TOWS Matrix ...
- Competitive strategy matrix template | SWOT Analysis Solution ...
- SWOT Analysis
- Swot Analysis Strengths, Weaknesses, Opportunities, and Threats ...
- Swot Analysis New Project Design
- SWOT Matrix Template | Matrices | How To Create the Involvement ...
- Ansoff's Product / Market matrix | SWOT Analysis Solution - Strategy ...
- SWOT Analysis Solution - Strategy Tools | Competitive strategy ...
- SWOT analysis matrix diagram | SWOT Analysis | Design elements ...
- SWOT Analysis Software | Design elements - SWOT and TOWS ...
- Ansoff's product / market matrix | How to Make SWOT Analysis in a ...
- Porter's generic strategies matrix diagram | Competitive strategy ...