SWOT Analysis

SWOT Analysis Software

SWOT Analysis

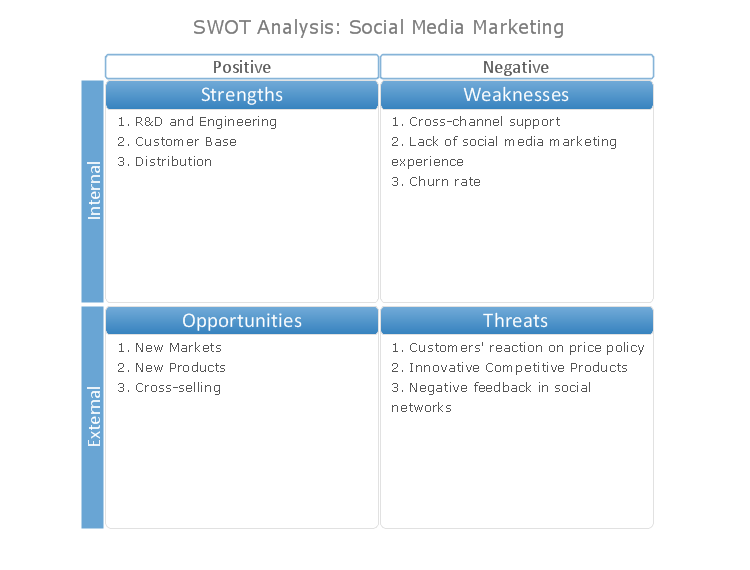
"A SWOT analysis is a tool that originated in the business world (Learned et al., 1969) but is useful for any kind of strategic planning. It's a relatively quick way to look at your Strengths, Weaknesses, Opportunities and Threats. Although it is not a substitute for an in-depth analysis, it can set the stage for one.
The overall purpose of a SWOT analysis is to examine the internal and external factors that help or hinder your department in achieving each of your objectives. It can be used as a brainstorming tool, simply to see how you (and perhaps some people outside of your department) see your department. It can also be used very effectively in the early stages of a program assessment, to help focus your attention on key areas." [serc.carleton.edu/ departments/ assessment/ swot.html]
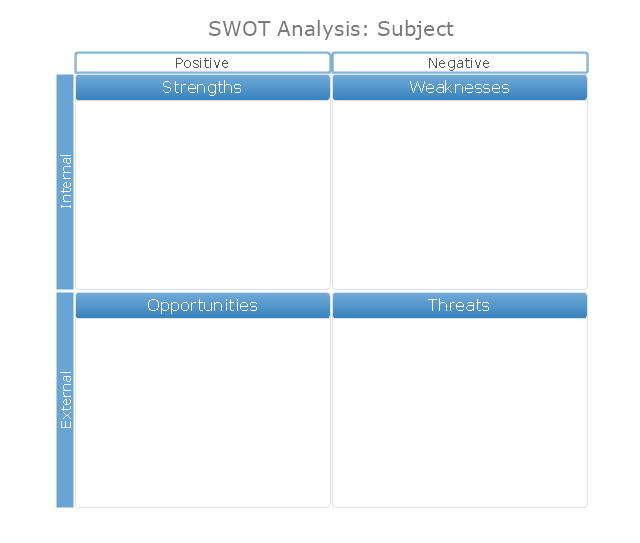
This SWOT analysis matrix diagram template for the ConceptDraw PRO diagramming and vector drawing software is included in the SWOT Analysis solution from the Management area of ConceptDraw Solution Park.
The overall purpose of a SWOT analysis is to examine the internal and external factors that help or hinder your department in achieving each of your objectives. It can be used as a brainstorming tool, simply to see how you (and perhaps some people outside of your department) see your department. It can also be used very effectively in the early stages of a program assessment, to help focus your attention on key areas." [serc.carleton.edu/ departments/ assessment/ swot.html]
This SWOT analysis matrix diagram template for the ConceptDraw PRO diagramming and vector drawing software is included in the SWOT Analysis solution from the Management area of ConceptDraw Solution Park.
SWOT matrix template
SWOT Analysis

Cross-Functional Flowchart


SWOT Matrix Blue Theme
Business Productivity - Management

SWOT Matrix Software

Cause and Effect Analysis - Fishbone Diagrams for Problem Solving

- It Department Swot Analysis
- Swot Analysis For Marketing Department
- Swot Analysis Of Software Department Example
- Swot Analysis For Business Development Department
- Sample Swot Analysis For Finance Department
- Quality Department Swot Analysis
- SWOT Analysis | Human Resource Development | SWOT and TOWS ...
- SWOT Analysis | Create a Basic Presentation Quickly | Human ...
- Example Of Swot Analysis For Maintenance Engineer