SWOT Matrix Template

How to Make SWOT Analysis in a Word Document

Authority Matrix Diagram Software

How to Create Presentation of Your Project Gantt Chart

Cross-Functional Flowcharts in ConceptDraw
Simple Drawing Applications for Mac

Basketball Plays Diagrams

 Interactive Voice Response Diagrams
Interactive Voice Response Diagrams solution extends ConceptDraw DIAGRAM software with samples, templates and libraries of ready-to-use vector stencils that help create Interactive Voice Response (IVR) diagrams illustrating in details a work of interactive voice response system, the IVR system’s logical and physical structure, Voice-over-Internet Protocol (VoIP) diagrams, and Action VoIP diagrams with representing voice actions on them, to visualize how the computers interact with callers through voice recognition and dual-tone multi-frequency signaling (DTMF) keypad inputs.
Biology Drawing

Create Organizational Chart

Create a Presentation Using a Design Template

 Fishbone Diagram
Fishbone Diagrams solution extends ConceptDraw DIAGRAM software with templates, samples and library of vector stencils for drawing the Ishikawa diagrams for cause and effect analysis.
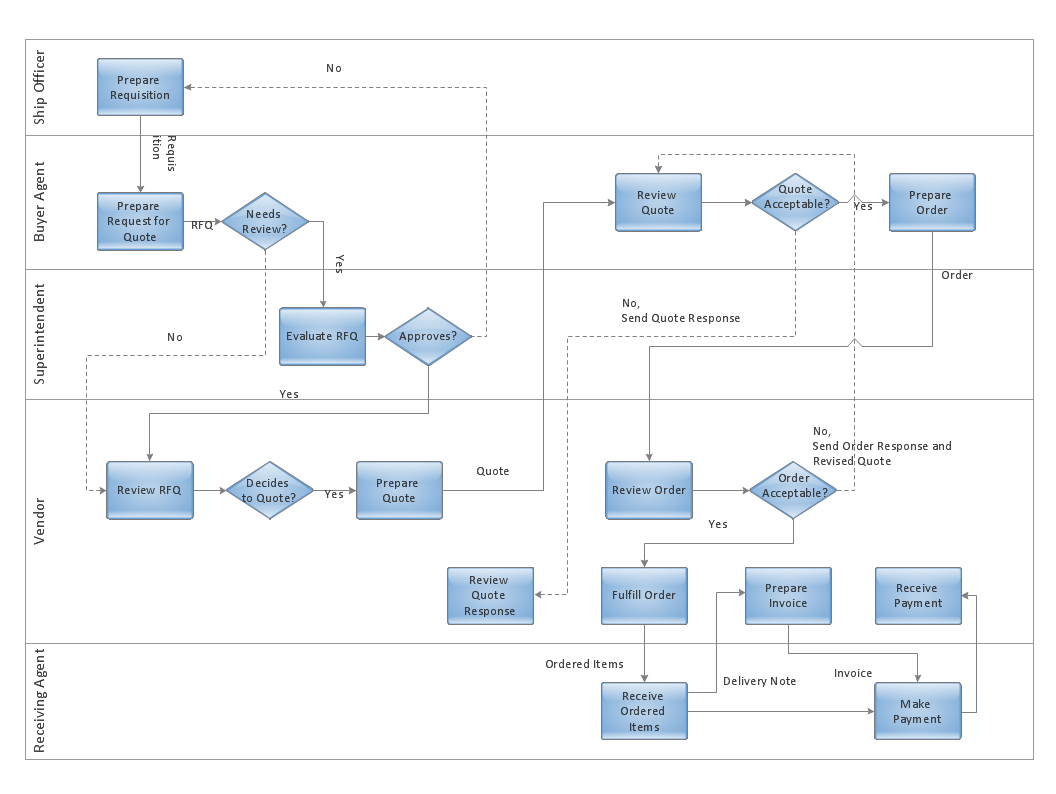
 Cross-Functional Flowcharts
Cross-functional flowcharts are powerful and useful tool for visualizing and analyzing complex business processes which requires involvement of multiple people, teams or even departments. They let clearly represent a sequence of the process steps, the order of operations, relationships between processes and responsible functional units (such as departments or positions).
 Event-driven Process Chain Diagrams
Event-Driven Process Chain Diagrams solution extends ConceptDraw DIAGRAM functionality with event driven process chain templates, samples of EPC engineering and modeling the business processes, and a vector shape library for drawing the EPC diagrams and EPC flowcharts of any complexity. It is one of EPC IT solutions that assist the marketing experts, business specialists, engineers, educators and researchers in resources planning and improving the business processes using the EPC flowchart or EPC diagram. Use the EPC solutions tools to construct the chain of events and functions, to illustrate the structure of a business process control flow, to describe people and tasks for execution the business processes, to identify the inefficient businesses processes and measures required to make them efficient.
- SWOT Analysis Solution - Strategy Tools | TOWS Matrix | TOWS ...
- Draw And Explain The Swot Analysis Matrix
- SWOT analysis matrix diagram templates | New business ...
- Strategic planning - Cycle diagram
- Competitor Analysis | Block diagram - Porter's five forces model ...
- SWOT Template | SWOT Analysis | Swot Analysis Examples | Export ...
- SWOT Matrix Template | SWOT analysis for a small independent ...
- By Using Diagram Explain The Porter Value Chain Model
- Ansoff Matrix | Matrices | Pyramid Diagram and Pyramid Chart ...
- Matrices | SWOT matrix template | Authority Matrix Diagram Software ...
- New business opportunity SWOT analysis matrix - Template portrait ...
- SWOT analysis matrix diagram templates | New business ...
- How to Make SWOT Analysis in a Word Document | Ansoff Model ...
- Successful Strategic Plan | Strategic planning - Cycle diagram ...
- What Is Swot Analysis Explanation Pdf
- SWOT Matrix Template
- SWOT analysis for a small independent bookstore | Site Plan ...
- Porter's Value Chain | Competitor Analysis | Matrices | Porters ...
- SWOT Analysis | SWOT analysis for a small independent bookstore ...
- SWOT analysis matrix diagram templates | Porter's value chain ...