HelpDesk
How to Add a Cross-Functional Flowchart to a PowerPoint Presentation

Cross-Functional Flowchart


Cross Functional Flowchart Examples

Cross Functional Flowchart
Swim Lane Flowchart Symbols

Swim Lanes Flowchart. Flowchart Examples


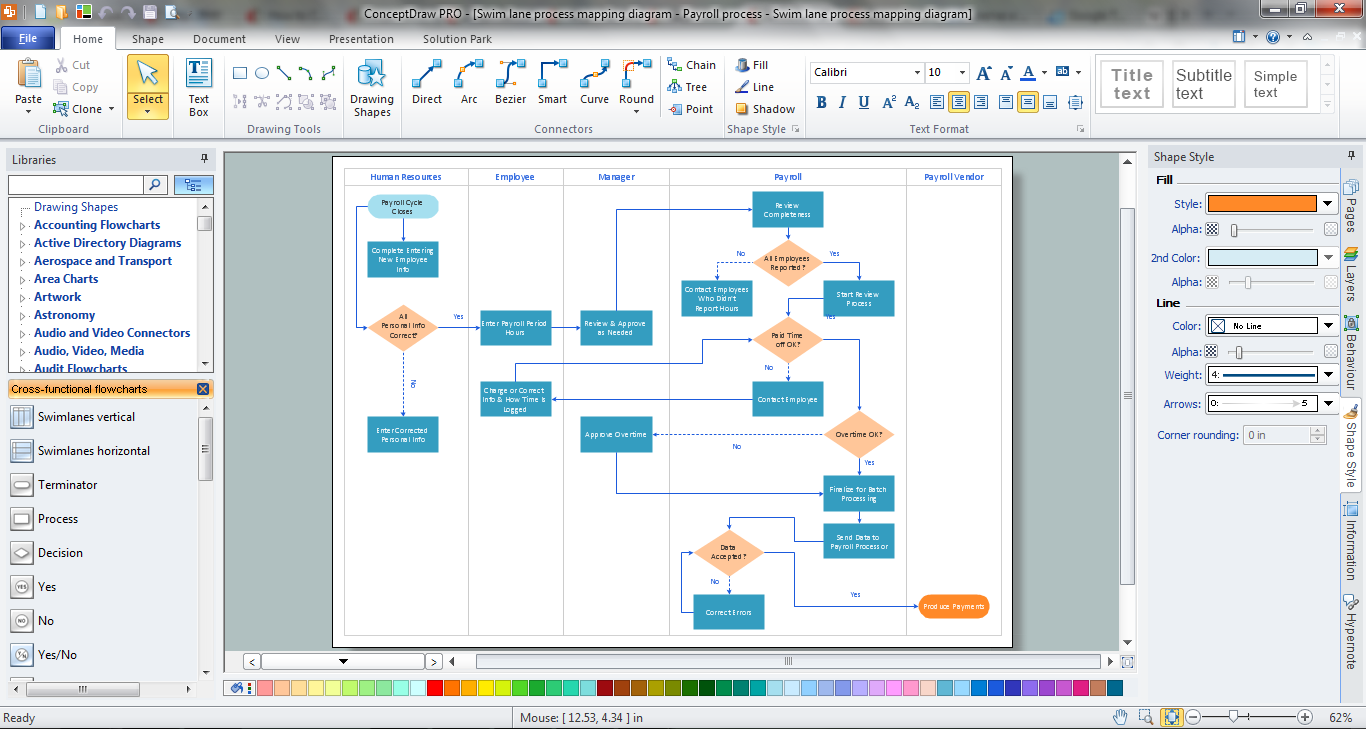
 Cross-Functional Flowcharts
Cross-functional flowcharts are powerful and useful tool for visualizing and analyzing complex business processes which requires involvement of multiple people, teams or even departments. They let clearly represent a sequence of the process steps, the order of operations, relationships between processes and responsible functional units (such as departments or positions).
How to Simplify Flow Charting — Cross-functional Flowchart

Types of Flowcharts


Swim Lane Diagrams

- Powerpoint Swimlane Flowchart Template
- Swimlane In Powerpoint
- Cross-Functional Flowcharts | Powerpoint Swimlanes Template
- Swim Lanes Flowchart . Flowchart Examples | Swim Lanes ...
- How to Add a Cross-Functional Flowchart to a PowerPoint ...
- Cross Functional Flowchart Template Powerpoint
- Ppt Swimlane Template
- Swim Lanes | Swim Lanes Flowchart . Flowchart Examples | How to ...
- Cross Functional Flowchart Template Excel