This site uses cookies. By continuing to browse the ConceptDraw site you are agreeing to our Use of Site Cookies.
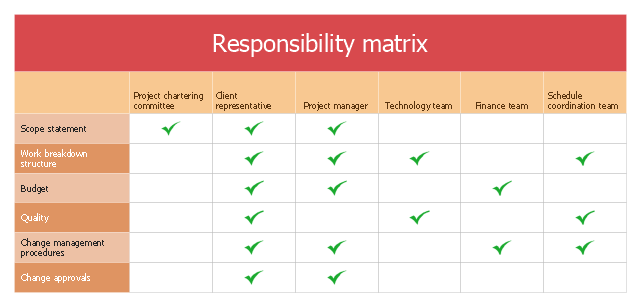
The responsibility matrix depicts key actions and decisions, main stakeholders and key responsibilities. Key activities are listed in the left most column, in approximate sequential order. Key stakeholders are listed as column headings above the next set of columns. For each row of action steps, a symbol is shown in the column for relevant stakeholders indicating who has responsibility for the step, who is involved. [anao.gov.au/ html/ Files/ BPG HTML/ Developing and Managing Contracts/ 2_ action_ matrix.html]
The involvement matrix example "Distribution of responsibilities" was created using the ConceptDraw PRO diagramming and vector drawing software extended with the solution "Seven Management and Planning Tools" from the Management area of ConceptDraw Solution Park.
Involvement matrix
Involvement matrix, action involvement matrix, involvement matrix,

Stakeholder Onion Diagrams

The Stakeholder Onion Diagram is a popular and widely used way to view the relationships of stakeholders to a project goal. The Onion Diagram focuses on the project goal, most of other diagram styles focus on the project, stakeholders, and timeline. This difference favorably distinguishes and separates the Onion Diagram from other types of diagrams.
Design fast and easy Stakeholder Onion Diagrams of any complexity in ConceptDraw PRO diagramming and vector drawing software using the powerful tools of Stakeholder Onion Diagrams Solution from the Management Area of ConceptDraw Solution Park.

Stakeholder Management System

Stakeholder management is a critical component to the successful delivery of any project, programme or activity.
ConceptDraw PRO is a powerful diagramming and vector drawing software. Now, thanks to the Stakeholder Onion Diagrams Solution included to the Management Area of ConceptDraw Solution Park, ConceptDraw PRO became also unique stakeholder management system design software.

Matrix Organization

Different organizations have different organizational structures. Matrix organization is one of the most popular and widely used type of organizational structure. Use ConceptDraw PRO diagramming and vector drawing software extended with 25 Typical Orgcharts solution from the Management area of ConceptDraw Solution Park for fast and easy designing matrix organizational chart for your company.

Prioritization Matrix

You can design the Prioritization Matrix by hand on the paper, but we offer you the most easier way - to use the ConceptDraw PRO diagramming and vector drawing software extended with Seven Management and Planning Tools Solution from the Management Area.

Org Chart Diagram

ConceptDraw Solution Park creates a single information space for messaging to teams. PM Teams provides project participants and organizations with better tools that assist in task understanding, timeframe understanding, and project events in the entire organization. Improved communication fosters positive team spirit throughout.

seven management and planning tools Seven Management and Planning Tools

seven management and planning tools
Seven Management and Planning Tools solution extends ConceptDraw PRO and ConceptDraw MINDMAP with features, templates, samples and libraries of vector stencils for drawing management mind maps and diagrams.

Organizational Structure Diagram Software

ConceptDraw PRO extended with Organizational Charts Solution from the Management Area is a powerful but easy-to-use Organizational Structure Diagram Software.
Organizational Charts Solution provides a wide variety of templates and samples and large quantity of predesigned vector objects to help you design your Organizational Structure Diagrams and other business diagrams.
How to draw an Organizational Chart

Six Markets Model Chart

This sample shows the Six Markets Model Chart. It was created in ConceptDraw PRO diagramming and vector drawing software using the Marketing Diagrams Solution from the Marketing area of ConceptDraw Solution Park.
The six markets model defines six markets that take the central place in the relationship marketing: internal markets, supplier markets, recruitment markets, referral markets, influence markets and customer markets. The six markets model allows the organization to analyze the stakeholders and key market domains that can be important to it.

Basic Flowchart Symbols and Meaning

Flowchart Symbols and Meaning - Provides a visual representation of basic flowchart symbols and their proposed use in professional workflow diagram, standard process flow diagram and communicating the structure of a well-developed web site, as well as their correlation in developing on-line instructional projects. See flowchart's symbols by specifics of process flow diagram symbols and workflow diagram symbols.
How to Build a Flowchart