Stakeholder Mapping Tool

How To Create Onion Diagram

Onion Diagram Process Design

 Stakeholder Onion Diagrams
The Stakeholder Onion Diagram is often used as a way to view the relationships of stakeholders to a project goal. A basic Onion Diagram contains a rich information. It shows significance of stakeholders that will have has influence to the success achieve
 ConceptDraw Solution Park
ConceptDraw Solution Park collects graphic extensions, examples and learning materials
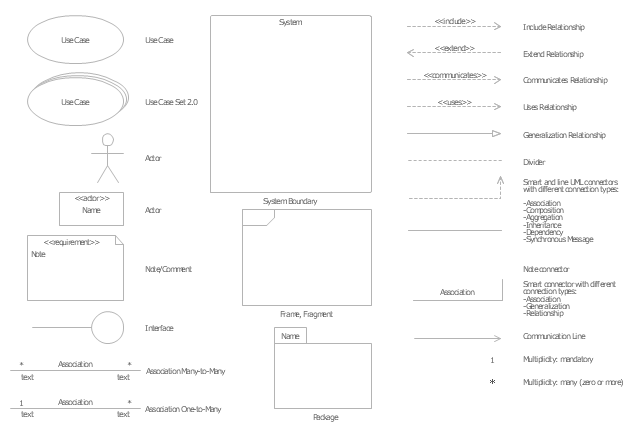
The vector stencils library "UML use case diagrams" contains 25 symbols for the ConceptDraw PRO diagramming and vector drawing software.
"Use case diagrams are usually referred to as behavior diagrams used to describe a set of actions (use cases) that some system or systems (subject) should or can perform in collaboration with one or more external users of the system (actors). Each use case should provide some observable and valuable result to the actors or other stakeholders of the system. ...
Use case diagrams are in fact twofold - they are both behavior diagrams, because they describe behavior of the system, and they are also structure diagrams - as a special case of class diagrams where classifiers are restricted to be either actors or use cases related to each other with associations. ...
Use case is usually shown as an ellipse containing the name of the use case. ...
Name of the use case could also be placed below the ellipse. ...
If a subject (or system boundary) is displayed, the use case ellipse is visually located inside the system boundary rectangle. Note, that this does not necessarily mean that the subject classifier owns the contained use cases, but merely that the use case applies to that classifier. ...
A list of use case properties - operations and attributes - could be shown in a compartment within the use case oval below the use case name. ...
Use case with extension points may be listed in a compartment of the use case with the heading extension points. ...
A use case can also be shown using the standard rectangle notation for classifiers with an ellipse icon in the upper right-hand corner of the rectangle and with optional separate list compartments for its features. ...
Subject (sometimes called a system boundary) is presented by a rectangle with subject's name, associated keywords and stereotypes in the upper left corner. Use cases applicable to the subject are located inside the rectangle and actors - outside of the system boundary. ...
Standard UML notation for actor is "stick man" icon with the name of the actor above or below of the icon. Actor names should follow the capitalization and punctuation guidelines for classes. The names of abstract actors should be shown in italics. ...
Custom icons that convey the kind of actor may also be used to denote an actor, such as using a separate icon(s) for non-human actors. ...
An actor may also be shown as a class rectangle with the standard keyword «actor», having usual notation for class compartments ...
An actor can only have binary associations to use cases, components, and classes. ...
An association between an actor and a use case indicates that the actor and the use case somehow interact or communicate with each other.
Only binary associations are allowed between actors and use cases.
An actor could be associated to one or several use cases. ...
A use case may have one or several associated actors." [uml-diagrams.org/ use-case-diagrams.html]
The example "Design elements - UML use case diagrams" is included in the Rapid UML solution from the Software Development area of ConceptDraw Solution Park.
UML use case diagram symbols
The vector stencils library "Management pictograms" contains 72 management pictograms.
Use it to create your management infogram in the ConceptDraw PRO diagramming and vector drawing software.
The flat icons example "Management pictograms - Vector stencils library" is included in the solution "Marketing infographics" from the "Business infographics" area of ConceptDraw Solution Park.
Use it to create your management infogram in the ConceptDraw PRO diagramming and vector drawing software.
The flat icons example "Management pictograms - Vector stencils library" is included in the solution "Marketing infographics" from the "Business infographics" area of ConceptDraw Solution Park.
Accounting management

Activity

Audit management

Board of directors

Budget

Business managemen

Business management tools

Business model

Commanding

Communication

Company

Contract management

Controlling

Coordinating

Core competencies

Corporate strategy

Creativity

Crisis management

Crisis management 2

Decision making

Environmental management

Expenses

External environment

Financial management

Financial management 2

Financial planning

First-level manager

Goal

HR management

Investment management

IT management

Knowledge management

Knowledge management 2

Leadership

Macro environment

Management system

Managerial accounting

Manufacturing management

Market orientation

Marketing management

Marketing strategy

Middle-level manager

Mission

Objectives

Operations management

Organizing

Performance

Performance management

Planning

Policy

PR management

Problem solving

Process management

Product management

Profit

Profit 2

Project management

Quality management

Research and development

Resource management

Resources

Risk management

Sales manegment

Service management

Stakeholder management

Strategic management

Strategic planning

Technology management

Time frame

Time management

Top-level manager

Vision

ConceptDraw Solution Park
ConceptDraw Solution Park collects graphic extensions, examples and learning materials
 Computer Network Diagrams
Computer Network Diagrams solution extends ConceptDraw DIAGRAM software with samples, templates and libraries of vector icons and objects of computer network devices and network components to help you create professional-looking Computer Network Diagrams, to plan simple home networks and complex computer network configurations for large buildings, to represent their schemes in a comprehensible graphical view, to document computer networks configurations, to depict the interactions between network's components, the used protocols and topologies, to represent physical and logical network structures, to compare visually different topologies and to depict their combinations, to represent in details the network structure with help of schemes, to study and analyze the network configurations, to communicate effectively to engineers, stakeholders and end-users, to track network working and troubleshoot, if necessary.
 macOS User Interface
macOS User Interface solution extends the ConceptDraw DIAGRAM functionality with powerful GUI software graphic design features and tools. It provides an extensive range of multifarious macOS Sierra user interface design examples, samples and templates, and wide variety of libraries, containing a lot of pre-designed vector objects of Mac Apps icons, buttons, dialogs, menu bars, indicators, pointers, controls, toolbars, menus, and other elements for fast and simple designing high standard user interfaces of any complexity for new macOS Sierra.
Network Diagram Software. LAN Network Diagrams. Physical Office Network Diagrams


How to Report Task's Execution with Gantt Chart

 Cisco Network Diagrams
Cisco Network Diagrams solution extends ConceptDraw DIAGRAM with the best characteristics of network diagramming software. Included samples, templates and libraries of built-in standardized vector Cisco network icons and Cisco symbols of computers, network devices, network appliances and other Cisco network equipment will help network engineers, network designers, network and system administrators, as well as other IT professionals and corporate IT departments to diagram efficiently the network infrastructure, to visualize computer networks topologies, to design Cisco computer networks, and to create professional-looking Cisco Computer network diagrams, Cisco network designs and schematics, Network maps, and Network topology diagrams in minutes.
 Marketing Area
The solutions from Marketing area of ConceptDraw Solution Park collect templates, samples and libraries of vector stencils for drawing the marketing diagrams and mind maps.
- Stakeholder Icons
- Conceptdraw.com: Mind Map Software, Drawing Tools | Project ...
- System Stakeholders Diagram
- People | Cisco People. Cisco icons , shapes, stencils and symbols ...
- Illustration Area | Business People Clipart | Vector clipart - People ...
- Diagramming software for Amazon Web Service icon set: Data Base ...
- Stakeholder Onion Diagram Template
- Cross Functional Flowchart Shapes Stencil | Cisco Optical. Cisco ...
- Windows Maximizee Button Icon
- Cross Functional Flowchart Shapes Stencil
- Flowchart design. Flowchart symbols, shapes, stencils and icons ...
- Cisco Buildings. Cisco icons , shapes, stencils and symbols | Cisco ...
- Business People Clipart | Vector clipart - People | Design elements ...
- Design elements - Business people vector clipart | Design elements ...
- Element Of System
- Flowchart design. Flowchart symbols, shapes, stencils and icons ...
- Cross Functional Flowchart Symbols
- Presentation Clipart | Business People Clipart | Beauty in nature ...
- Project management - Design Elements | GUI Prototyping with ...
- Presentation Clipart | Business and Finance | Design elements ...