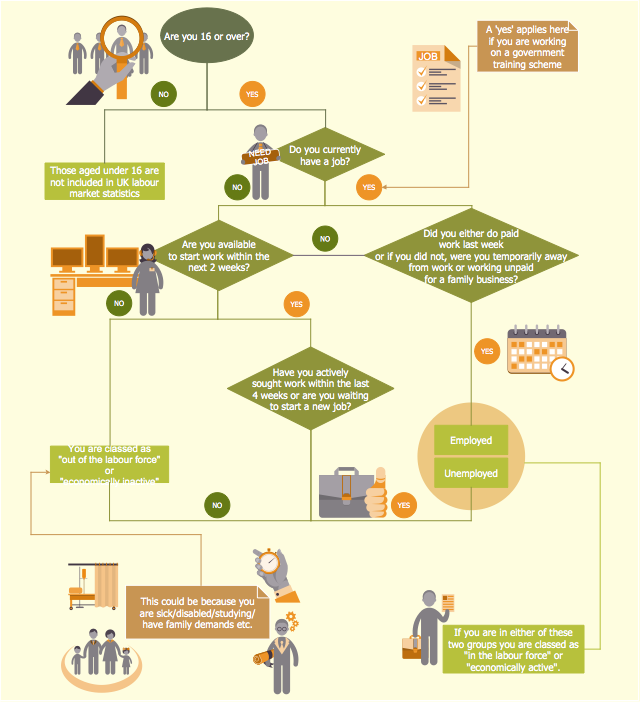
HR flowchart "UK Labour Market Categories" was redesigned from the Wikipedia file: UK Labour Market Categories.png.
"Flow chart showing the different categories in the UK labour market such as employed, unemployed and economically inactive." [commons.wikimedia.org/ wiki/ File:UK_ Labour_ Market_ Categories.png]
This file is licensed under the Creative Commons Attribution-Share Alike 3.0 Unported license. [creativecommons.org/ licenses/ by-sa/ 3.0/ ]
"Employment is a relationship between two parties, usually based on a contract, one being the employer and the other being the employee. ...
An employee contributes labor and expertise to an endeavor of an employer and is usually hired to perform specific duties which are packaged into a job. An Employee is a person who is hired to provide services to a company on a regular basis in exchange for compensation and who does not provide these services as part of an independent business. ...
Employer and managerial control within an organization rests at many levels and has important implications for staff and productivity alike, with control forming the fundamental link between desired outcomes and actual processes. Employers must balance interests such as decreasing wage constraints with a maximization of labor productivity in order to achieve a profitable and productive employment relationship." [Employment. Wikipedia]
The HR flow chart example "UK labour market categories" was created using the ConceptDraw PRO diagramming and vector drawing software extended with the HR Flowcharts solution from the Management area of ConceptDraw Solution Park.
HR flowchart

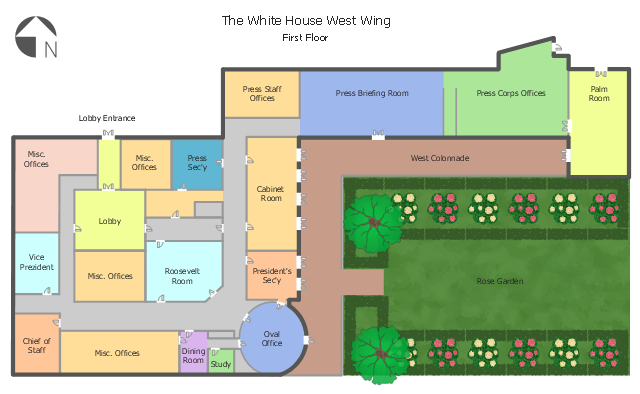
This architectural drawing sample was designed on the base of the Wikimedia Commons file: White House West Wing - 1st Floor.png.
"A floorplan of the first floor of the West Wing of the White House. Note that, depending on the administration, some positions (V.P., Chief of Staff, etc.) may be located in different offices than are shown here."
[commons.wikimedia.org/ wiki/ File:White_ House_ West_ Wing_ -_ 1st_ Floor.png]
"The West Wing of the White House, also known as the Executive Office Building, houses the offices of the President of the United States. The West Wing contains the Oval Office, the Cabinet Room, the Situation Room, and the Roosevelt Room.
The West Wing's three floors contain offices for the White House Chief of Staff, the Counselor to the President, the Senior Advisor to the President, the White House Press Secretary, and their support staffs. The Vice-President has an office in the building, but his primary office is next door in the Eisenhower Executive Office Building." [West Wing. Wikipedia]
The architectural drawing example "White House West Wing - 1st floor" was created using the ConceptDraw PRO diagramming and vector drawing software extended with the Floor Plans solution from the Building Plans area of ConceptDraw Solution Park.
Architectural drawing
How to Build a Flowchart

Pyramid Diagram

This example was created on the base of the figure from the website of Minnesota Department of Health. [health.state.mn.us/ divs/ opi/ qi/ images/ fishbone_ ex.png]
"Minnesota’s Health Alert Network (HAN) enables public health staff, tribal governments, health care providers, emergency workers, and others working to protect the public to exchange information during a disease outbreak, environmental threat, natural disaster, or act of terrorism." [health.state.mn.us/ han/ ]
The fishbone diagram example "HAN project" was created using the ConceptDraw PRO diagramming and vector drawing software extended with the Fishbone Diagrams solution from the Management area of ConceptDraw Solution Park.
Ishikawa diagram

Local area network (LAN). Computer and Network Examples
. Computer and Network Examples")

UML Deployment Diagram. Design Elements

This value stream map example was redesigned from the Wikipedia file: ValueStreamMapParts.png.
[en.wikipedia.org/ wiki/ File:ValueStreamMapParts.png]
This file is licensed under the Creative Commons Attribution-Share Alike 3.0 Unported license. [creativecommons.org/ licenses/ by-sa/ 3.0/ deed.en]
"Value stream mapping (VSM) refers to the activity of developing a visual representation of the flow of processes, from start to finish, involved in delivering a desired outcome, service, or product (a “value stream”) that is valued by customers. In the context of government, a value stream could be the process of conducting an audit, completing a procurement, or hiring new agency staff. VSM can increase understanding of actual decision-making processes and identify sources of non-value-added time (e.g., documents waiting to be reviewed). The typical products of a 2-5 day VSM workshop are a map of the “current state” of targeted processes and a “future state” map of the desired process flow and an associated implementation plan for future process improvement activities." [en.wikibooks.org/ wiki/ Business_ Analysis_ Guidebook/ LEAN]
The VSM diagram example "Value stream map parts" was created using the ConceptDraw PRO diagramming and vector drawing software extended with the Value Stream Mapping solution from the Quality area of ConceptDraw Solution Park.
Value stream mapping

Chart Examples

Flow Chart Symbols
