Spatial Data Analysis

 ConceptDraw Solution Park
ConceptDraw Solution Park collects graphic extensions, examples and learning materials
 Spatial Infographics
Spatial infographics solution extends ConceptDraw PRO software with infographic samples, map templates and vector stencils libraries with design elements for drawing spatial information graphics.
 Spatial Dashboard
Spatial dashboard solution extends ConceptDraw PRO software with templates, samples and vector stencils libraries with thematic maps for drawing visual dashboards showing spatial data.
 Fault Tree Analysis Diagrams
This solution extends ConceptDraw PRO v9.5 or later with templates, fault tree analysis example, samples and a library of vector design elements for drawing FTA diagrams (or negative analytical trees), cause and effect diagrams and fault tree diagrams.
 SWOT and TOWS Matrix Diagrams
SWOT and TOWS Matrix Diagrams solution extends ConceptDraw PRO and ConceptDraw MINDMAP software with features, templates, samples and libraries of vector stencils for drawing SWOT and TOWS analysis matrices and mind maps.
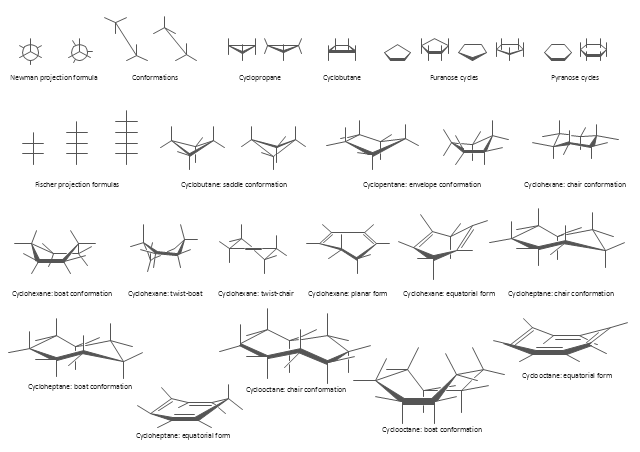
The vector stencils library "Conformations" contains 32 symbols of ring conformations, Newman and Fisher projections for chemical and biochemical drawing the molecular models and structural formulas of organic molecules and biochemical metabolites. It is useful in stereochemistry for drawing spatial structures of conformers of organic molecules, and schemes of stereospecific chemical reactions in organic synthesis.
"In chemistry, conformational isomerism is a form of stereoisomerism in which the isomers can be interconverted exclusively by rotations about formally single bonds (refer to figure on single bond rotation). Such isomers are generally referred to as conformational isomers or conformers and, specifically, as rotamers. Rotations about single bonds are restricted by a rotational energy barrier which must be overcome to interconvert one conformer to another. Conformational isomerism arises when the rotation about a single bond is relatively unhindered. That is, the energy barrier must be small enough for the interconversion to occur.
Conformational isomers are thus distinct from the other classes of stereoisomers (i. e. configurational isomers) where interconversion necessarily involves breaking and reforming of chemical bonds. For example, L- & D and R- & S- configurations of organic molecules have different handedness and optical activities, and can only be interconverted by breaking one or more bonds connected to the chiral atom and reforming a similar bond in a different direction or spatial orientation.
The study of the energetics between different rotamers is referred to as conformational analysis. It is useful for understanding the stability of different isomers, for example, by taking into account the spatial orientation and through-space interactions of substituents. In addition, conformational analysis can be used to predict and explain product(s) selectivity, mechanisms, and rates of reactions." [Conformational isomerism. Wikipedia]
The chemical symbols example "Design elements - Conformations" was created using the ConceptDraw PRO software extended with the Chemistry solution from the Science and Education area of ConceptDraw Solution Park.
Molecular conformations and projections
 Business Productivity Area
Business Productivity Solutions extend ConceptDraw products with tools for making presentations, conducting meetings, preparing documents, brainstorming, or building new strategies.
 Fishbone Diagrams
The Fishbone Diagrams solution extends ConceptDraw PRO v10 software with the ability to easily draw the Fishbone Diagrams (Ishikawa Diagrams) to clearly see the cause and effect analysis and also problem solving. The vector graphic diagrams produced using this solution can be used in whitepapers, presentations, datasheets, posters, and published technical material.
 Seven Management and Planning Tools
Seven Management and Planning Tools solution extends ConceptDraw PRO and ConceptDraw MINDMAP with features, templates, samples and libraries of vector stencils for drawing management mind maps and diagrams.
HelpDesk
How to Create a Fault Tree Analysis Diagram (FTD) in ConceptDraw PRO

HelpDesk
How to Create SWOT Analysis Template Using ConceptDraw PRO

 What are Infographic Area
Solutions of the area What is Infographics from ConceptDraw Solution Park collect templates, samples and vector stencils libraries with design elements for the drawing information graphics.
HelpDesk
How to Make SWOT Analysis in a Word Document

HelpDesk
How to Create a SWOT Matrix Quickly

HelpDesk
How to Create a PowerPoint Presentation from a SWOT Matrix

HelpDesk
How to Use Critical Path Analysis for Scheduling Complex Projects

- Sales Dashboard Template | Europe spatial dashboard template ...
- SWOT Analysis | Spatial Infographics | ConceptDraw Solution Park ...
- Fishbone Diagram | Spatial Infographics | Management | Fishbone ...
- SWOT Sample in Computers | Fishbone Diagram | Restaurant Floor ...
- SWOT Analysis Tool for Small Business | SWOT Analysis | How to ...
- SWOT Analysis Tool for Small Business | SWOT Analysis | Cross ...
- Restaurant Floor Plans Samples | Quality Mind Maps - samples and ...
- Sales Dashboard Template | Sales Dashboard Examples | Sales ...
- SWOT analysis Software & Template for Macintosh and Windows ...
- SWOT Analysis | Metro Map | How to draw Metro Map style ...
- Map Infographic Creator | Visualization Spatial Data Using Thematic ...
- Business Intelligence Dashboard Software | Meter Dashboard ...
- Mind Map Exchange | Swot Analysis Examples for Mac OSX ...
- Map Infographic Creator | Spatial infographics Design Elements ...
- Sales Dashboard - Access Anywhere | Frequency Distribution ...
- Marketing | Fishbone Diagram | SWOT analysis Software ...
- Business Intelligence Dashboard Software | Location Intelligence ...
- Map Infographic Creator | How to draw Metro Map style infographics ...
- How to draw Metro Map style infographics? (London) | Infographic ...
- Map Infographic Creator | Visualization Spatial Data Using Thematic ...